Financial
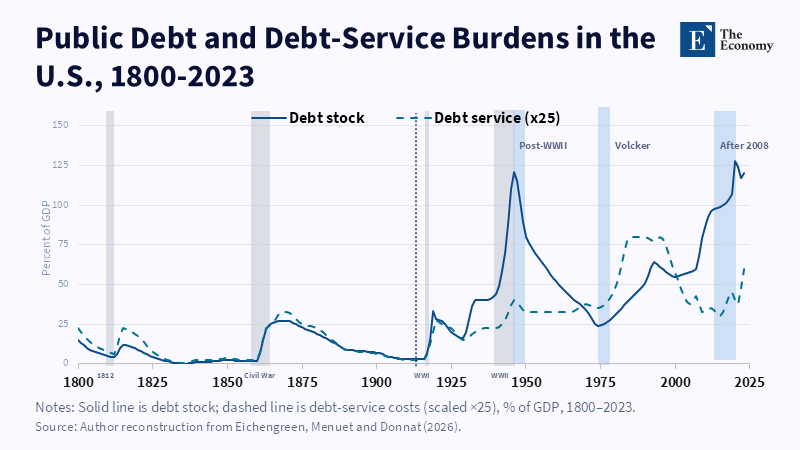
The lines split hard twice: debt soars after WWII while service costs barely move; service costs soar in the 1980s while debt stays flat. Related Articles:
Read More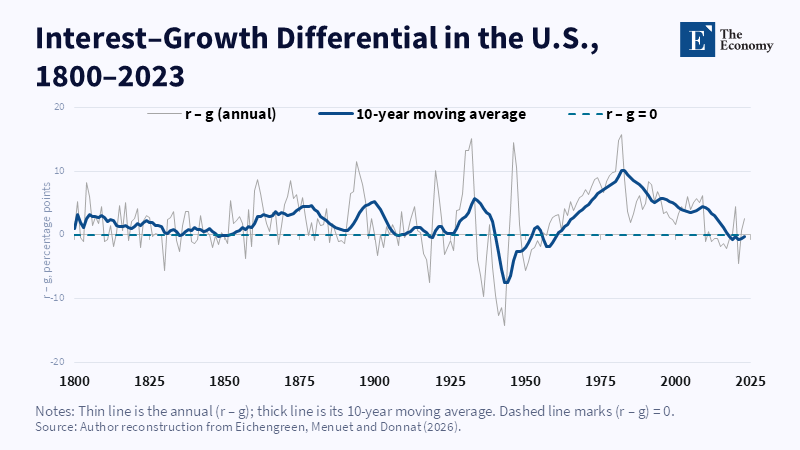
Every stretch above zero, especially the 1980s, lines up with real fiscal tightening.
Read More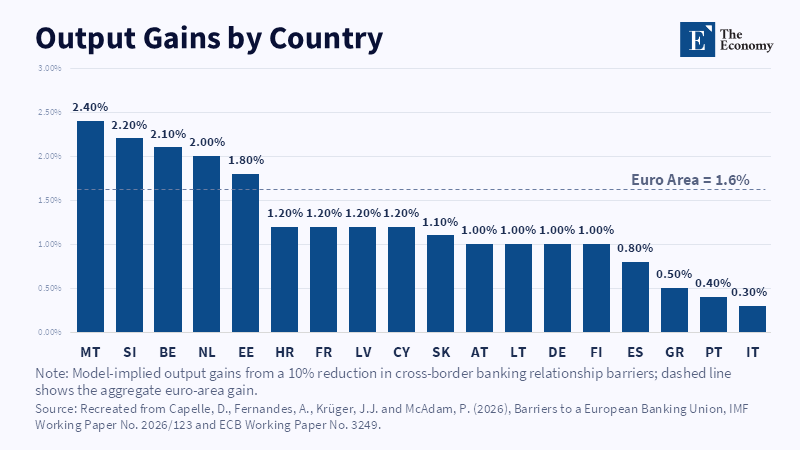
Lower cross-border banking barriers raise output across the euro area, although the gains vary sharply by country. Related Articles:
Read More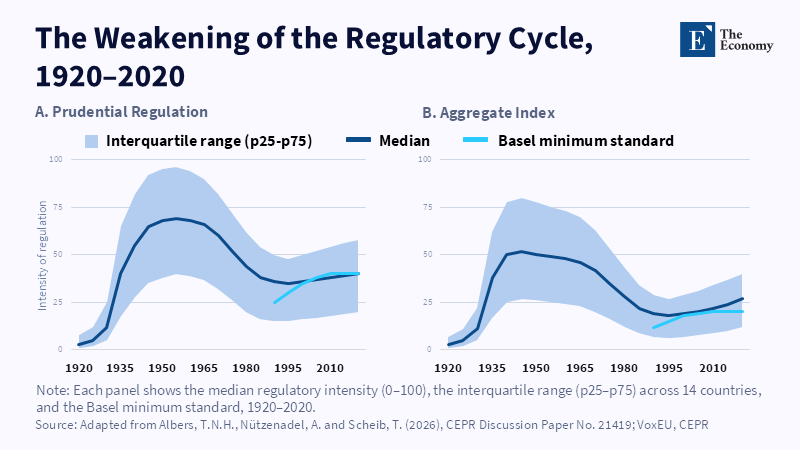
Regulation strengthened far less after 2008 than after earlier financial crises. Related Articles: When Euro Banks Fail: The Case for Cross-Border Banki
Read More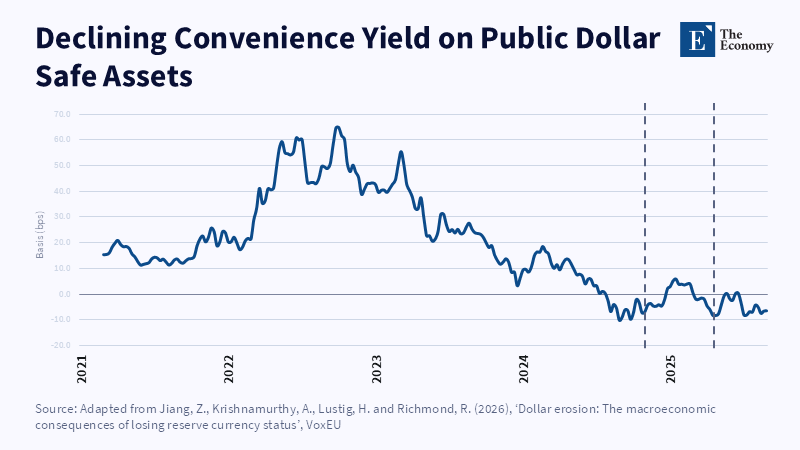
The convenience yield on US public safe assets has fallen sharply and remained near or below zero since late 2024. Related Articles: The Dolla
Read More







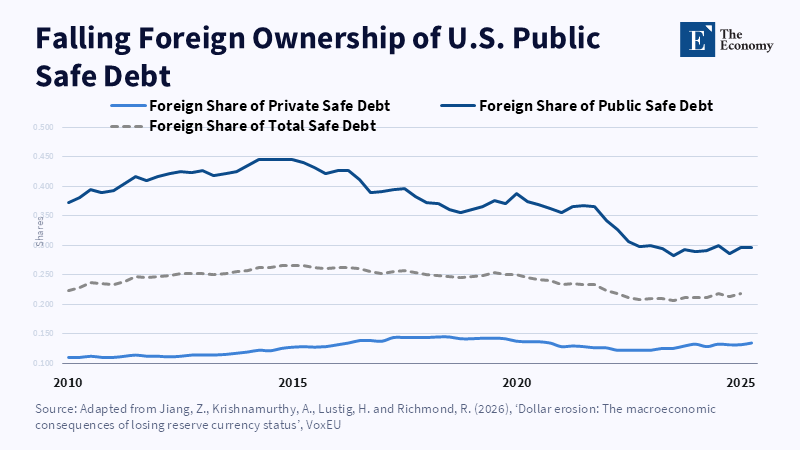
Foreign ownership of US public safe debt has fallen from roughly 45% to around 30%, while foreign ownership of private safe debt has remained broadly stable. Related Articles:
Read More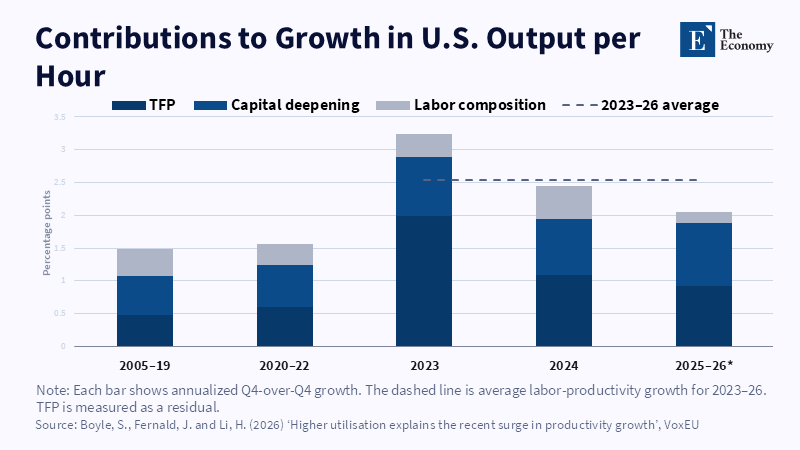
The post-2022 acceleration is concentrated in TFP, while capital deepening and labour composition contribute much less. Related Articles: The Cost Rese
Read More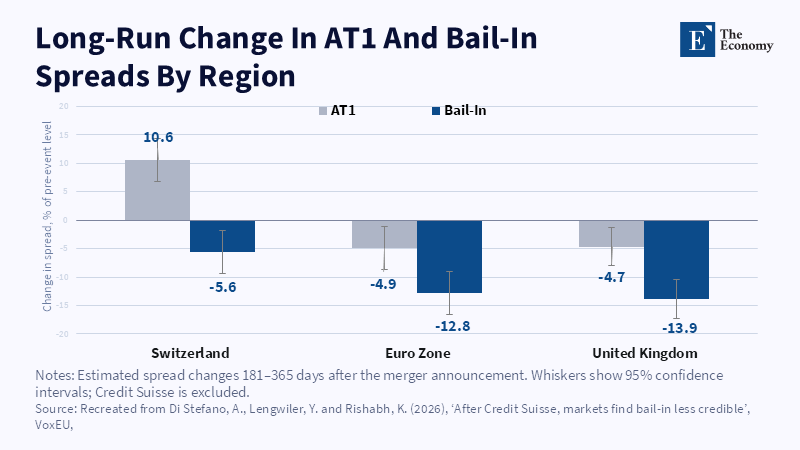
Bail-in spreads fell across all three regions, indicating that investors viewed future bail-in as less likely after Credit Suisse. Related Articles:
Read More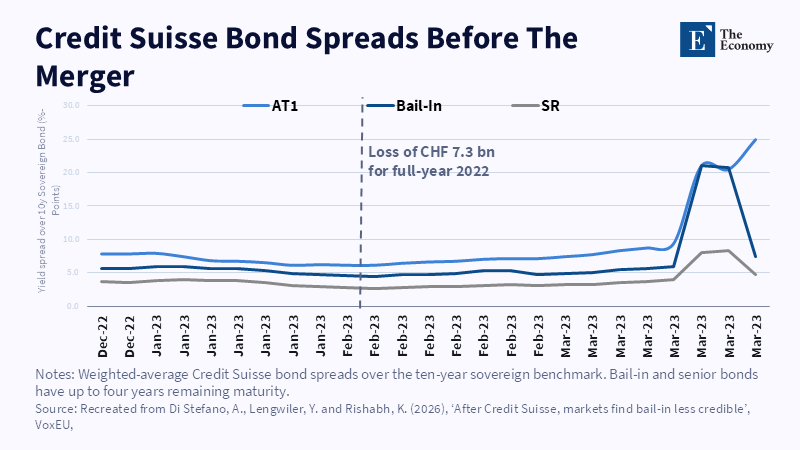
AT1 and bail-in spreads rose together before the merger, showing that investors expected both creditor layers to absorb losses. Related Articles: The
Read More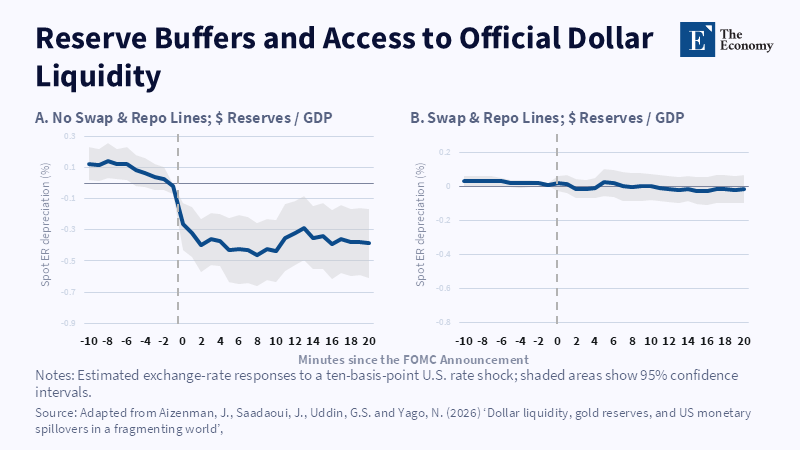
Note: Dollar reserves blunt Fed shocks mainly where countries lack official swap or repo access. Related article: Gold Cannot Stop a Dollar Run: Why Dollar S
Read More
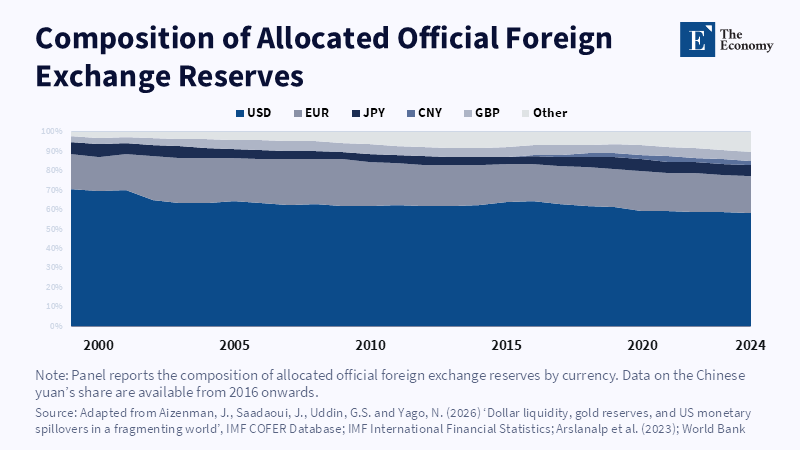
Note: The dollar still dominates official reserves, even as reserve managers diversify around the edges. Related article: Gold Cannot Stop a Dollar Run: Why D
Read More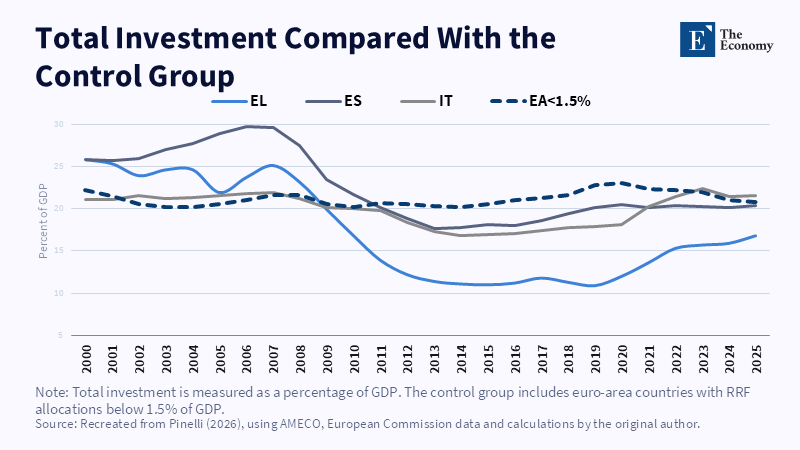
Note: Greece and Italy posted the largest rises in investment shares, while Spain’s increase was modest. Related article:
Read More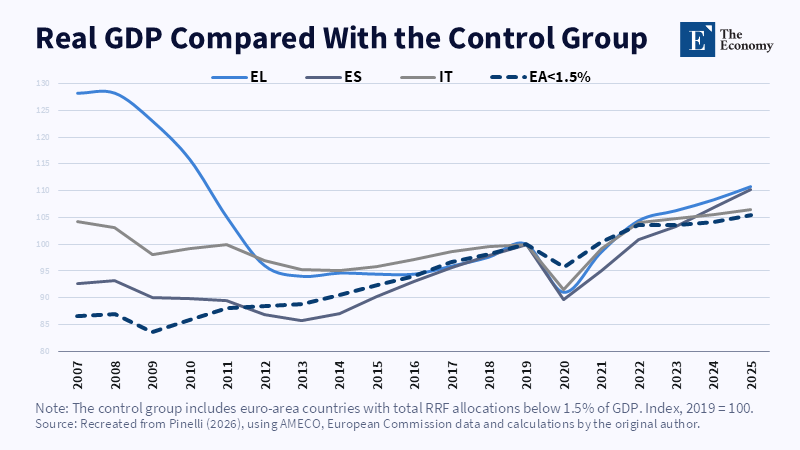
Note: Greece and Spain recorded the strongest output gains, while all three countries outperformed the low-allocation group. Related article:
Read More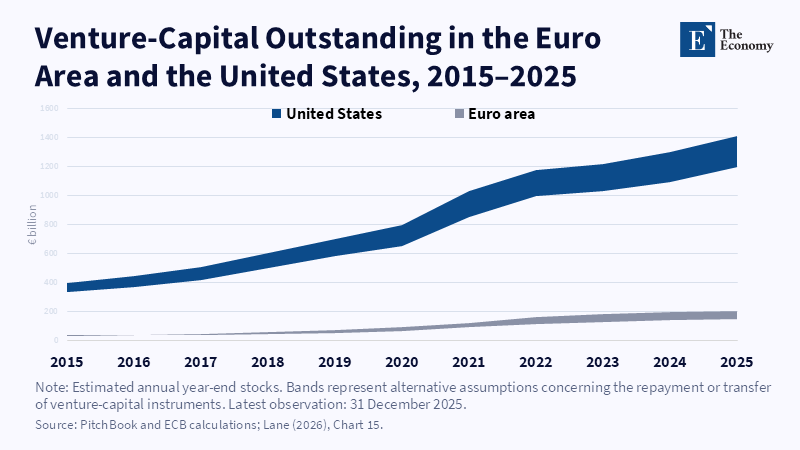
Note: The euro area’s smaller venture-capital base limits late-stage scaling and domestic ownership retention. Related article: Europe
Read More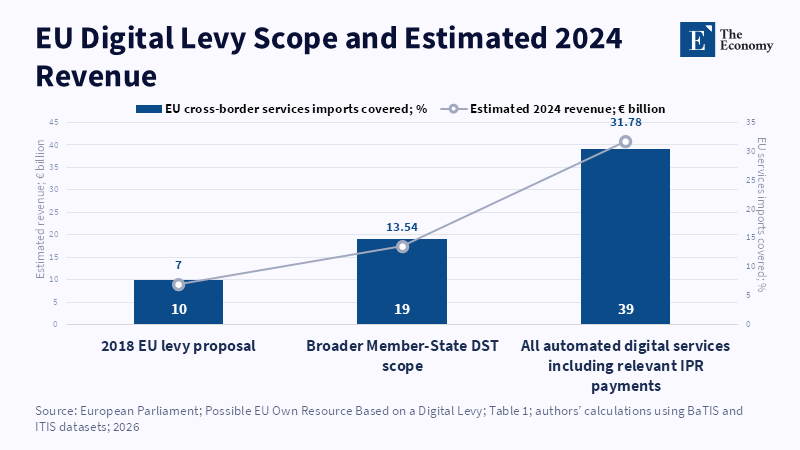
Note: Broader coverage raises more revenue but turns the levy into a wider tax on cross-border digital services. Related article: Taxing AI
Read More
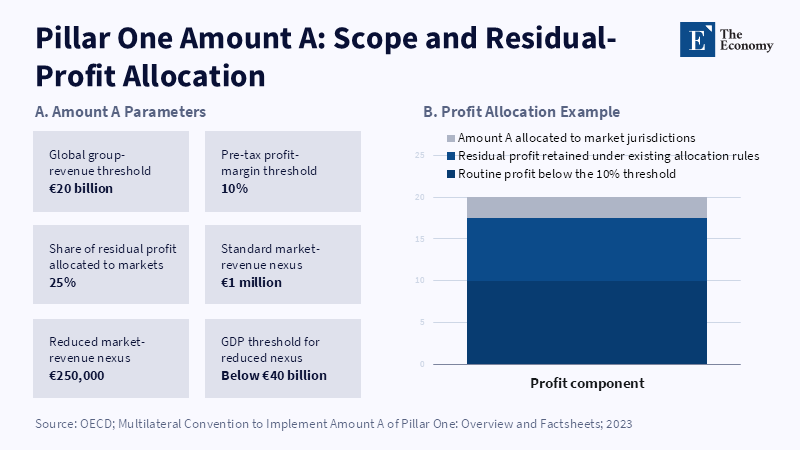
Note: Amount A would reallocate only 25% of profit above the 10% profitability threshold to eligible market jurisdictions.
Read More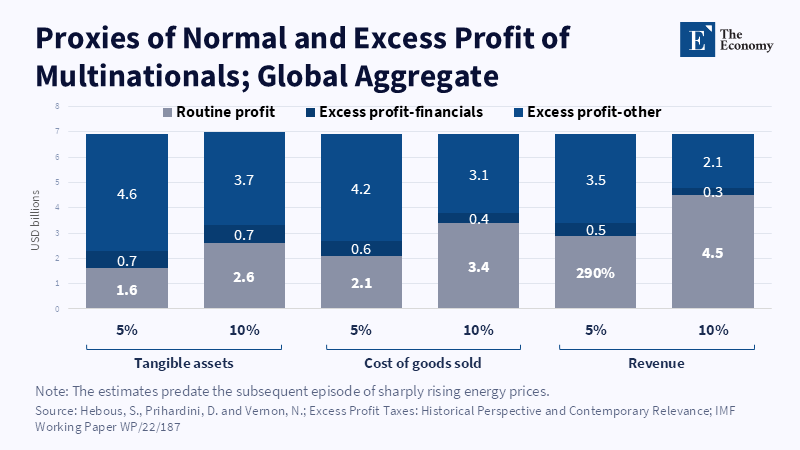
Note: The measured share of excess profit changes sharply with the benchmark used to define a normal return. Related article: Taxing AI Profi
Read More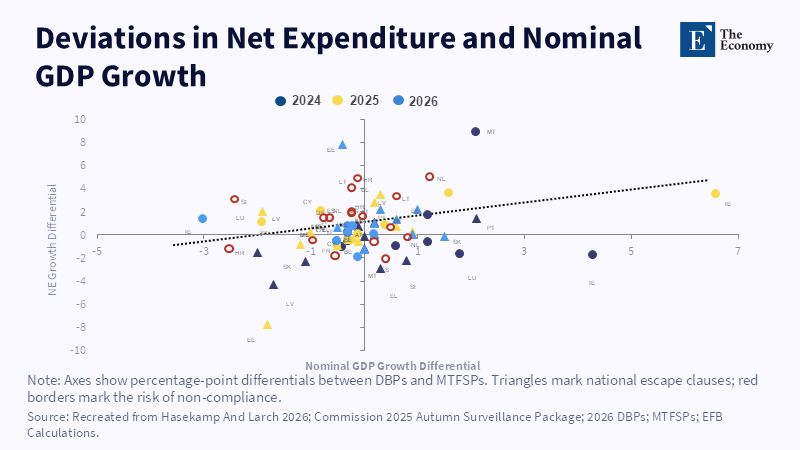
Note: Most observations remain procyclical, showing that expenditure plans still respond to short-term growth surprises.
Read More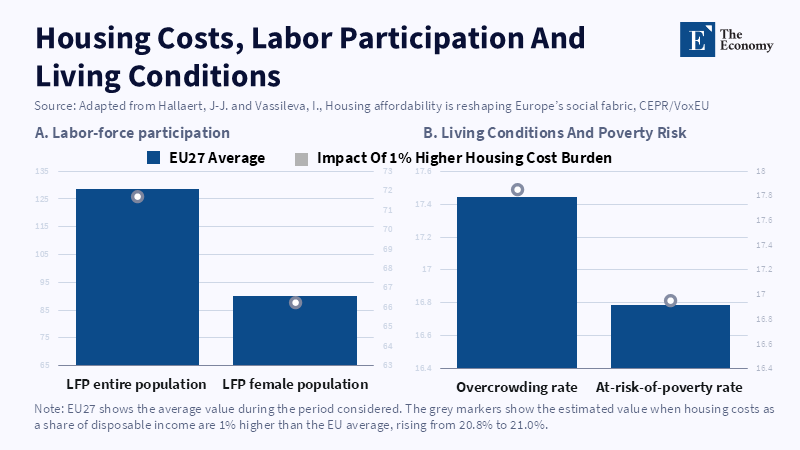
Figure 1: Even a small rise in the housing-cost burden is linked to lower labour-force participation and worse living conditions, reinforcing housing as a labour-market constraint. Related article:
Read More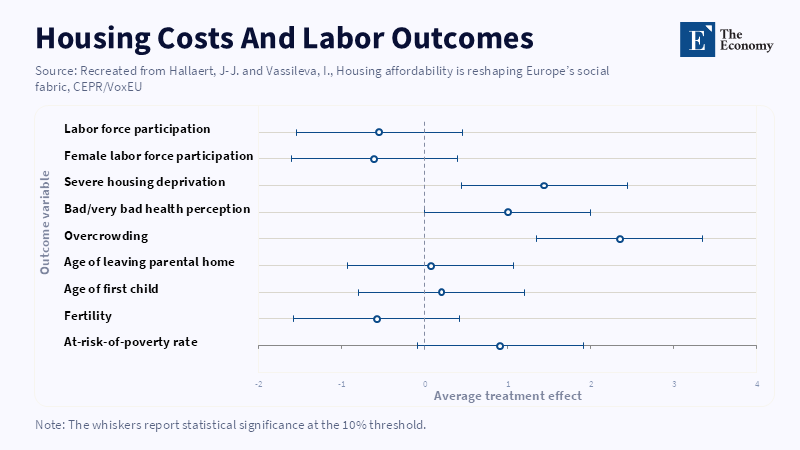
Figure 1: Higher housing costs are associated with weaker labour participation and wider social strain, especially overcrowding, housing deprivation, poverty risk and health pressure. Related articl
Read More