
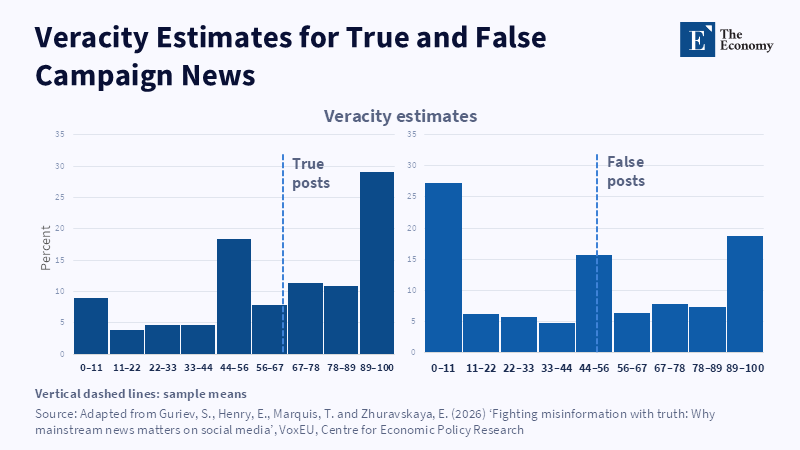
True posts were rated higher on average, but false posts still attracted enough belief to show why trusted information must be tested, not assumed. Related Articles:
Read More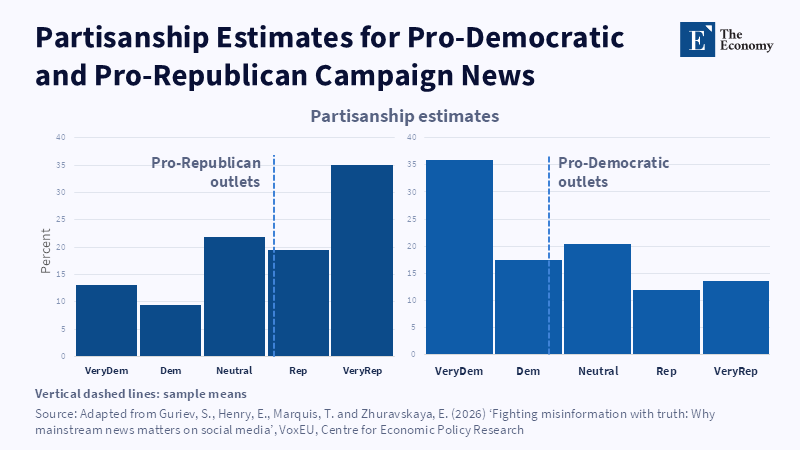
Readers identified partisan direction more clearly than factual accuracy, showing why political identity can overpower a mainstream media label. Related Articles:
Read More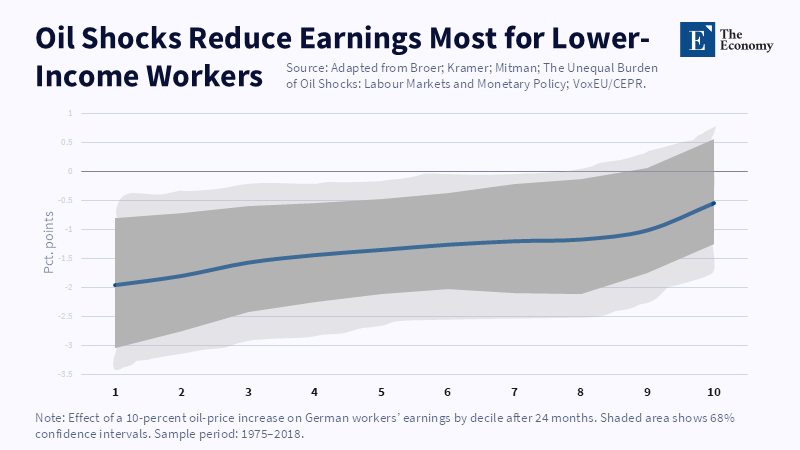
Lower-income workers suffer the clearest earnings loss two years after a 10% oil-price increase, showing why oil shocks quickly become inequality shocks.
Read More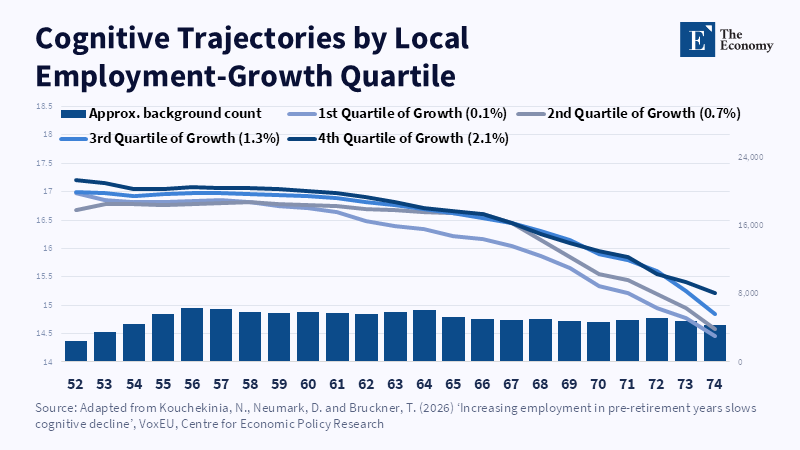
The employment-cognition link is visible but uneven, supporting caution rather than a simple claim that work protects the brain. Related Articles:
Read More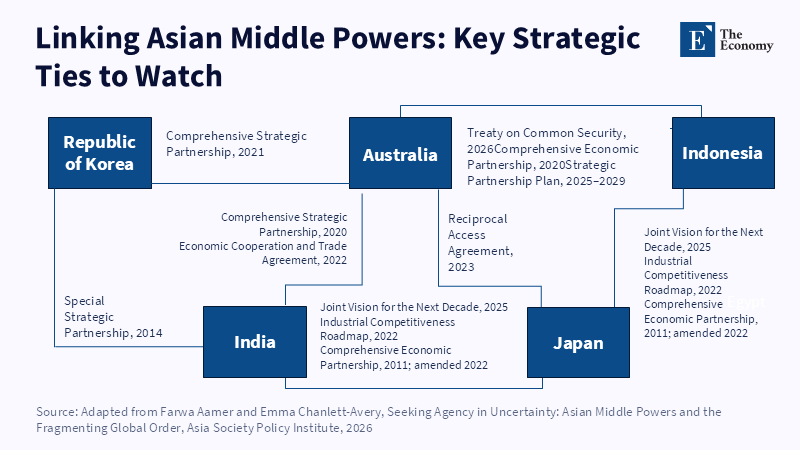
Asian middle-power agency is already taking shape through practical security, trade and strategic ties, not through a formal bloc. Related Articles:
Read More


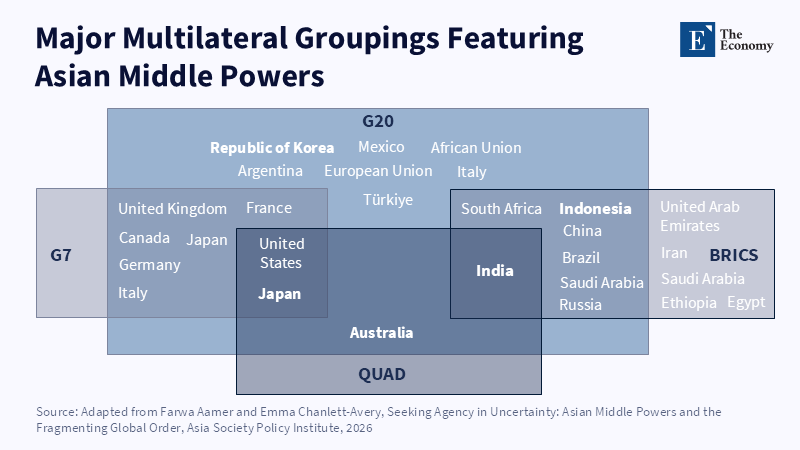
India’s middle-power role is not isolated; it sits inside overlapping forums that connect Western, Global South and Indo-Pacific agendas Related Articles:
Read More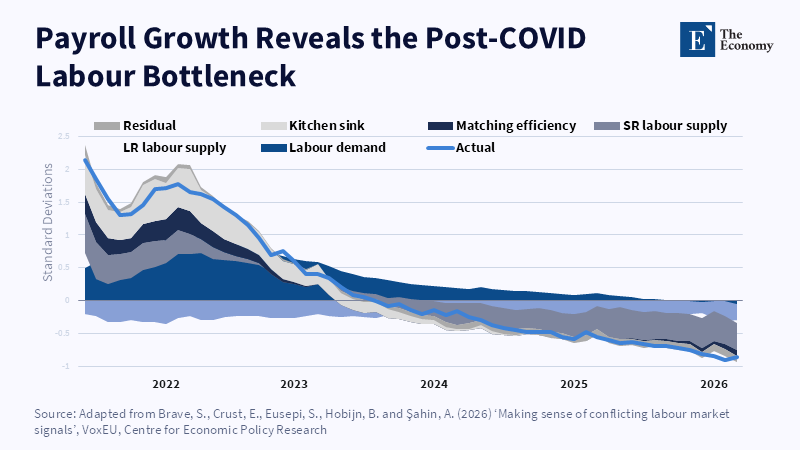
Payroll growth shows that the recovery was constrained not only by demand, but also by labour supply, matching and missing work capacity. Related Articles:
Read More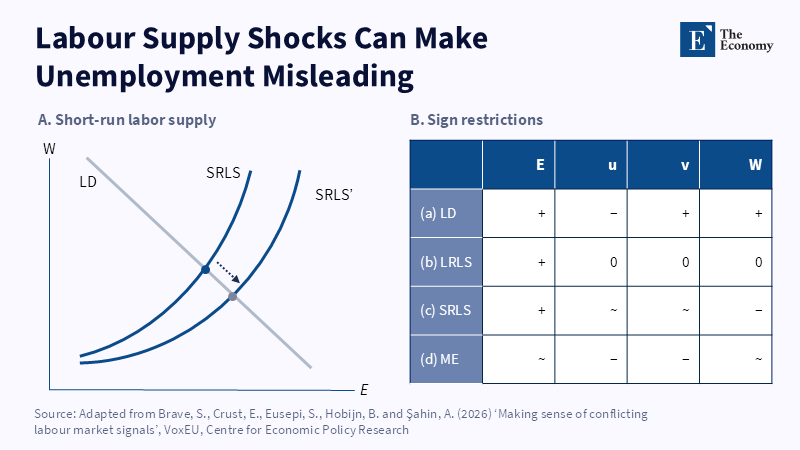
A supply shock can change employment and wages while leaving unemployment too calm to reveal the real bottleneck. Related Articles: The Unemployment Rate
Read More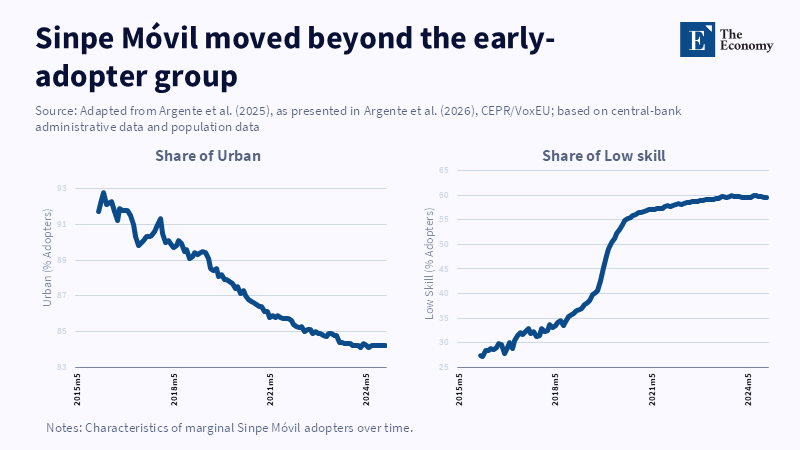
As Sinpe Móvil scaled, new adopters became less urban and more likely to be lower-skill workers, showing that inclusive payment systems spread beyond the early-adopter group. Related Articles:
Read More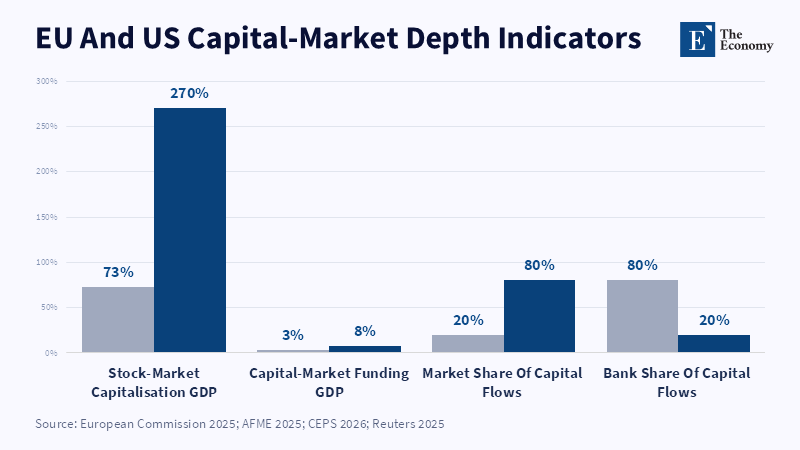
Europe’s capital-market deficit is not one gap, but a system-wide weakness across equity depth, market funding and bank dependence. Related Articles: Europe’s Savings Paradox: Why Abundance
Read More
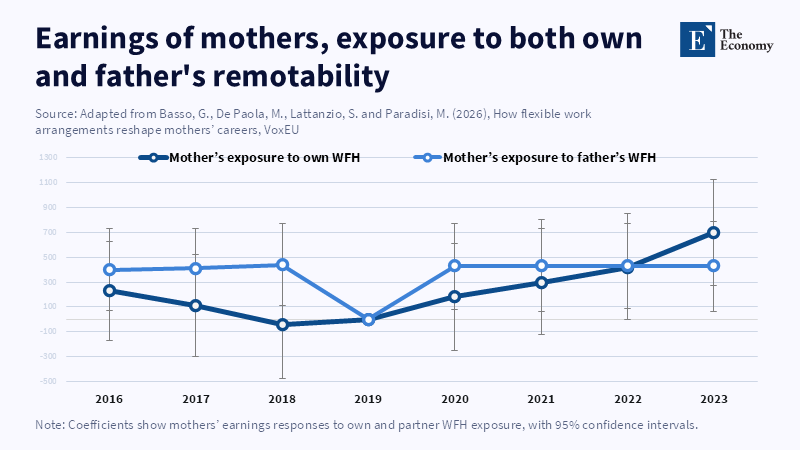
Mothers’ earnings improve not only with their own WFH exposure, but also when fathers or partners have more remote-work capacity. Related Articles: WFH Jobs Are Becomi
Read More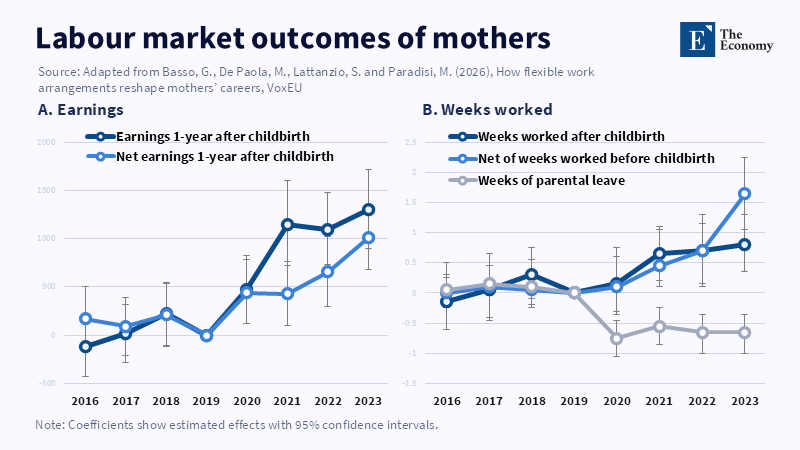
WFH exposure is linked to higher mothers’ earnings and more weeks worked after childbirth, while parental leave falls after 2020. Related Articles: WFH Jobs Are Becomin
Read More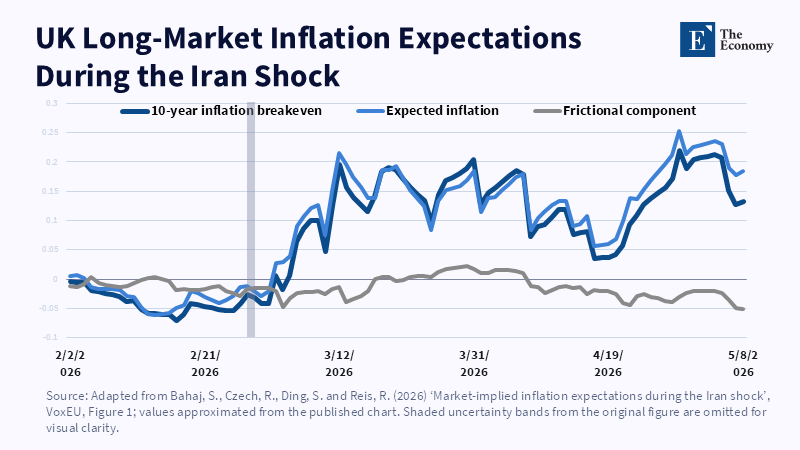
The UK long-market signal rose during the Iran shock, while the frictional component stayed much flatter, showing why raw bond-market inflation signals should be filtered before being treated as true expectations.
Read More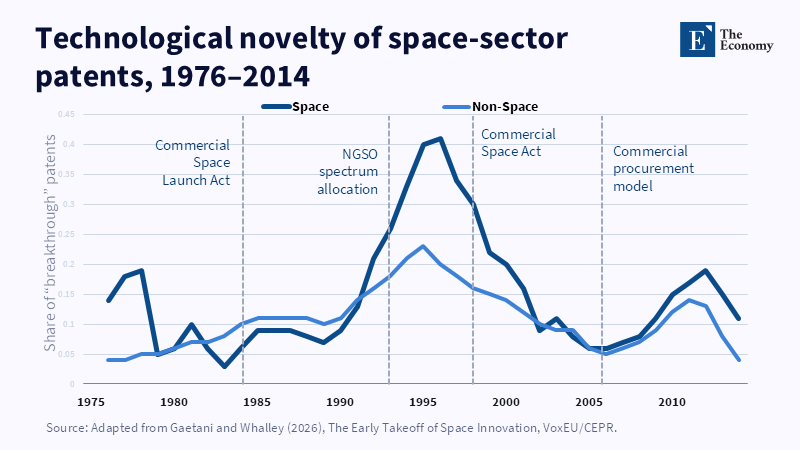
Market-making did not only raise patenting volume; it also changed the type of innovation space firms pursued. Related Articles: Space Innovation Fun
Read More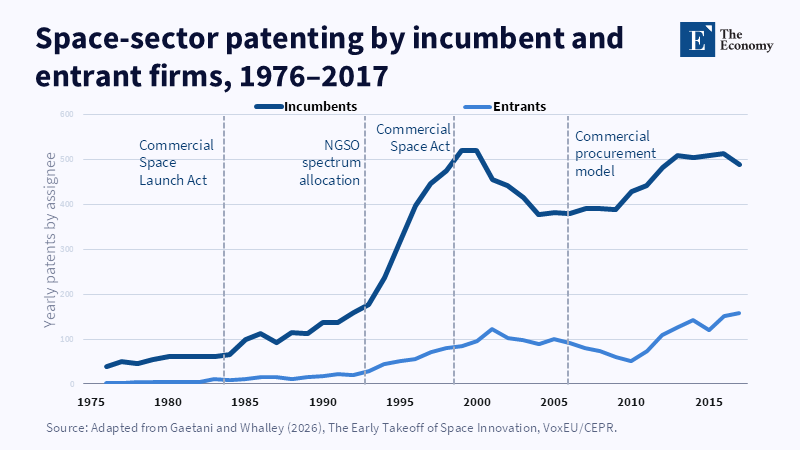
Entrants begin to matter when public rules and procurement make the space market credible. Related Articles: Space Innovation Funding Is the Missing H
Read More
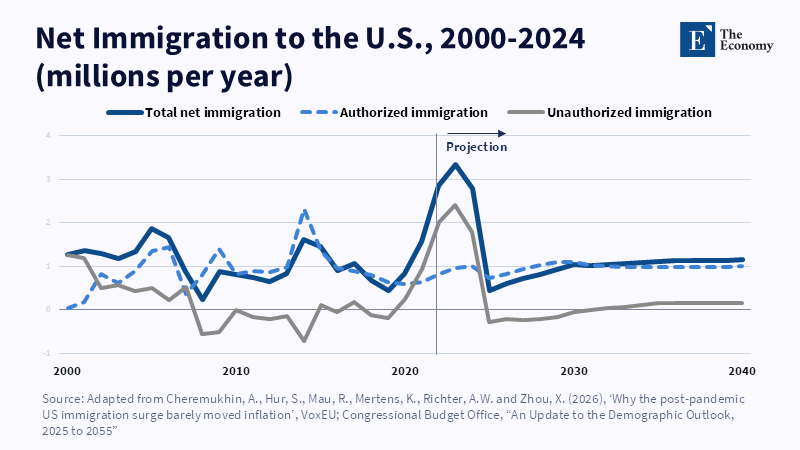
The immigration surge was large, but projections show it was not a permanent doubling of consumer demand.
Read More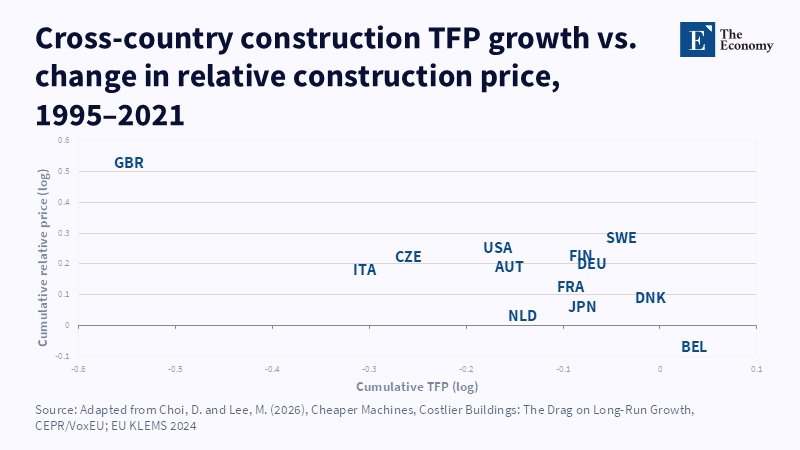
Across advanced economies, weaker construction TFP growth is associated with higher relative construction prices.
Read More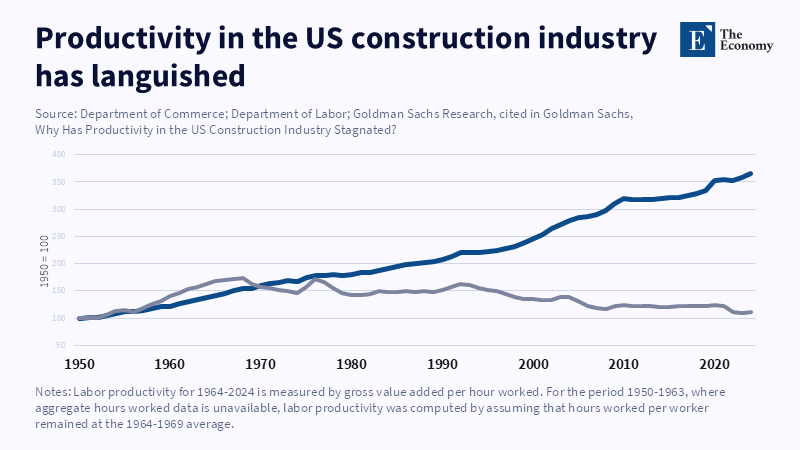
U.S. economy-wide labor productivity has risen sharply since 1950, while construction labor productivity has barely improved.
Read More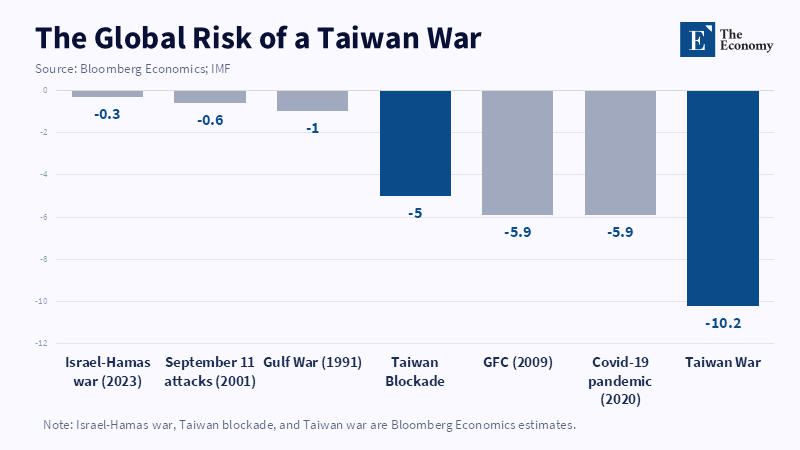
A Taiwan war would not be a regional shock.
Read More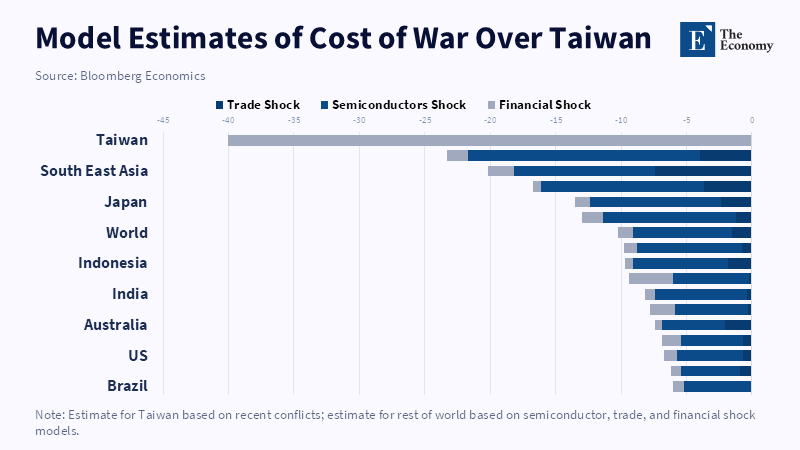
Japan’s exposure in a Taiwan war would come less from direct combat than from chips, trade disruption, and financial spillovers. Related Articles:
Read More