
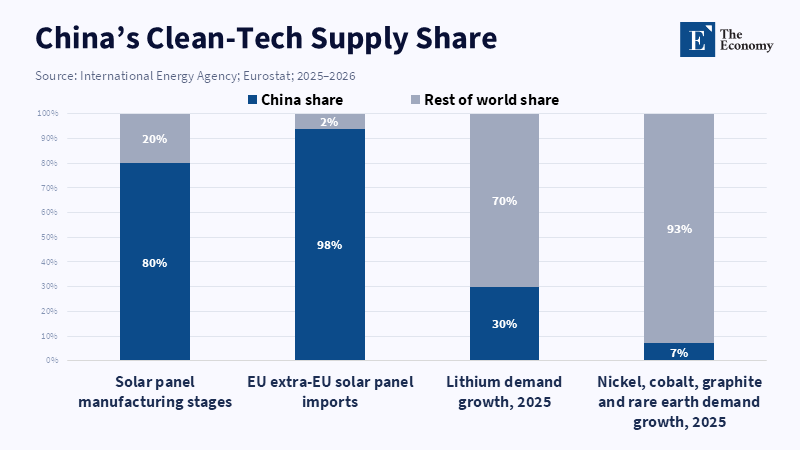
China’s clean-tech dominance shows why cheaper supply can become a strategic dependency problem for Europe. Related Articles: China’s Subsidy Mo
Read More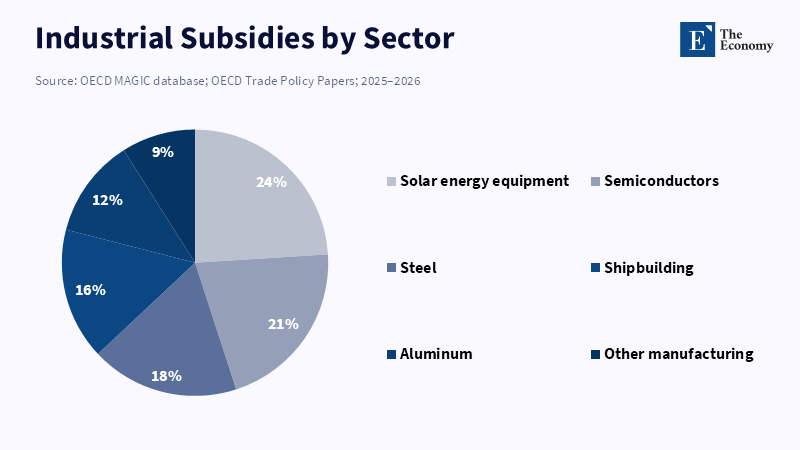
Subsidies are concentrated in sectors that now shape the next phase of industrial competition: solar, chips, steel, aluminium and shipbuilding. Related Articles:
Read More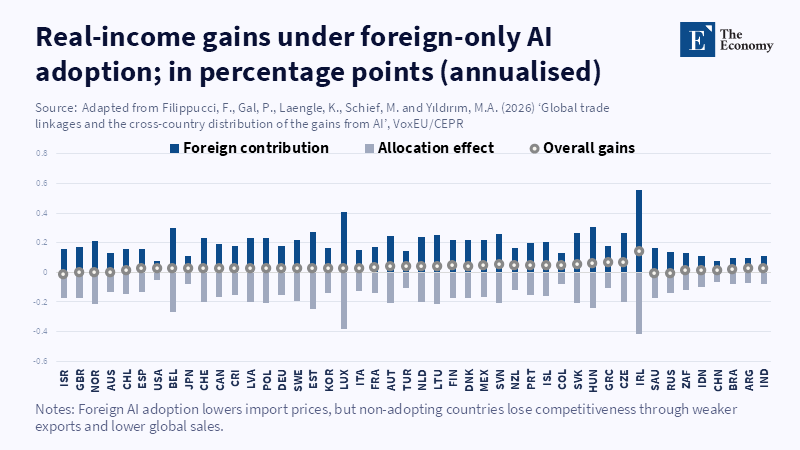
Foreign AI adoption can lower import prices, but non-adopting countries face competitiveness losses through weaker exports and lower global sales. Related Articles:
Read More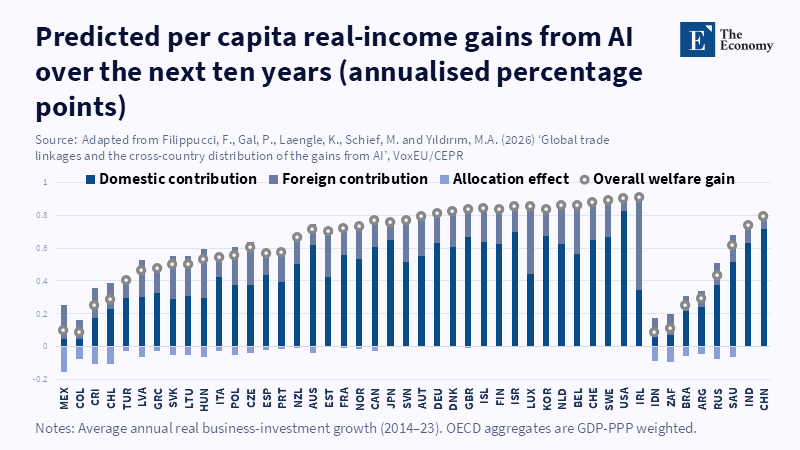
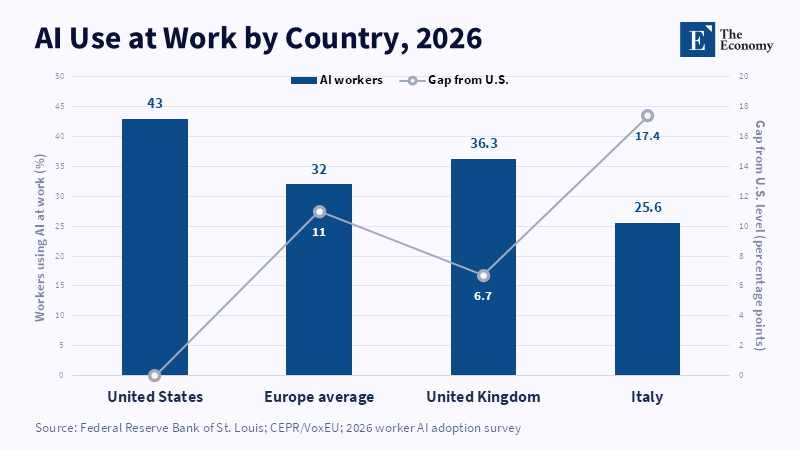
AI’s macroeconomic gains are not evenly distributed; countries capture different benefits depending on adoption speed, sector exposure and trade position. Related Articles:
Read More


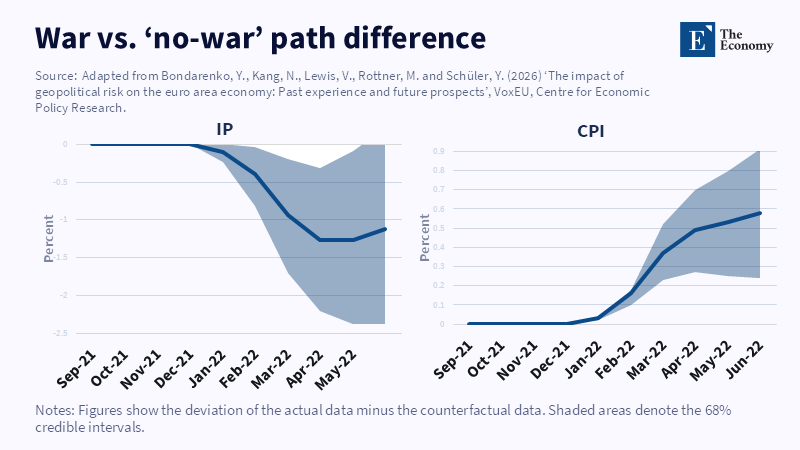
The rise in geopolitical risk following the outbreak of the Ukraine war is estimated to have weighed on eurozone industrial output while driving consumer prices higher. Related Articles:
Read More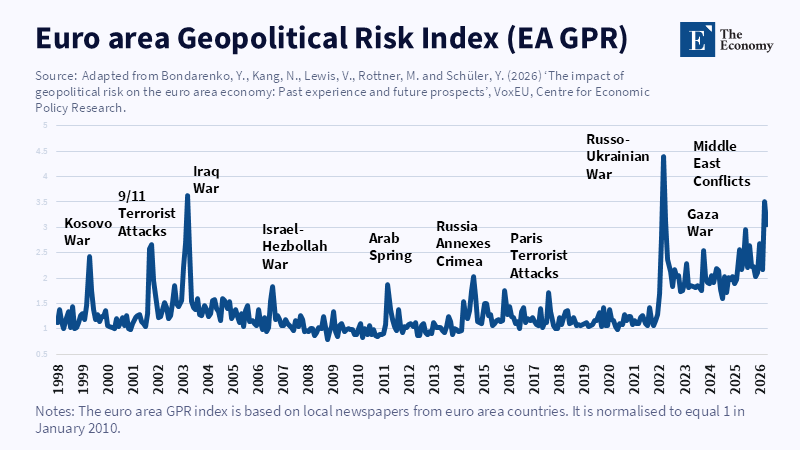
The euro-area GPR index shows why regional measurement matters: after 2022, Europe’s risk signal remained structurally higher than its pre-war norm. Related Articles:
Read More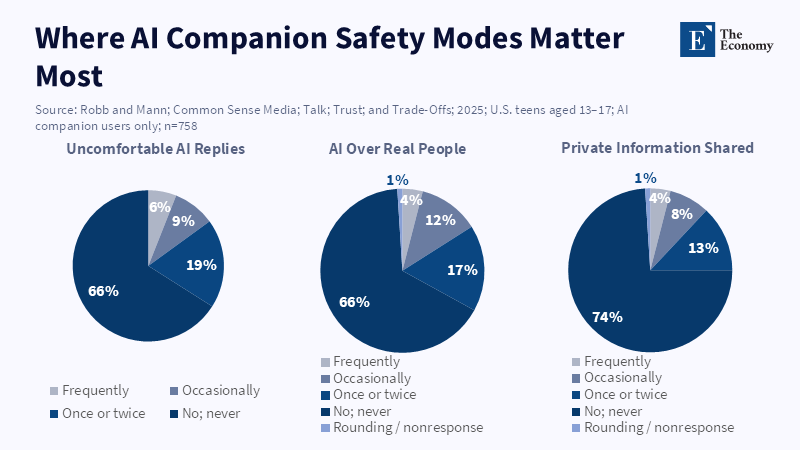
The highest-risk cases are minority behaviors, but they are large enough to justify child defaults, privacy controls and stricter mode settings. Related Articles:
Read More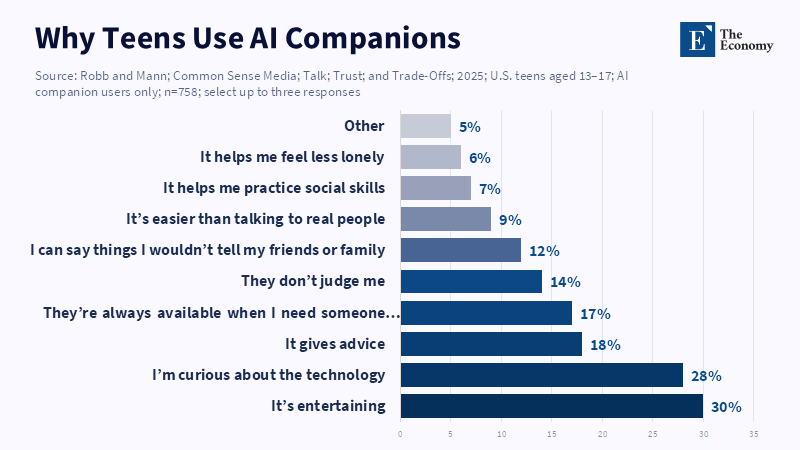
Teen use is driven by entertainment and curiosity, but the emotional-use reasons show why safety modes need to be adjustable. Related Articles: AI Companio
Read More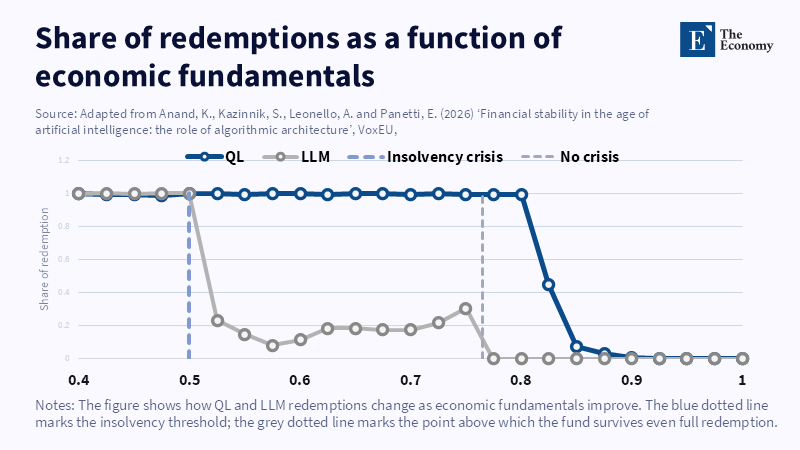
QL-style investors remain prone to redemption even as fundamentals improve, while LLM redemptions fall earlier.
Read More
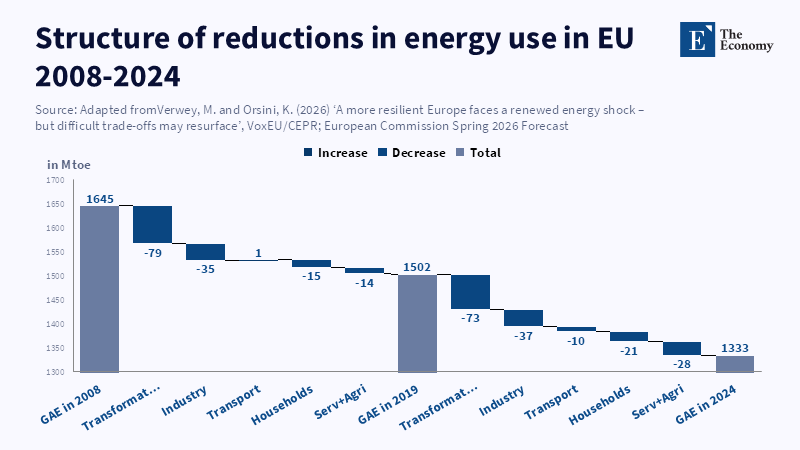
The fall in EU energy use shows adjustment and structural change, but not yet a full escape from imported fuel dependence. Related Articles: E
Read More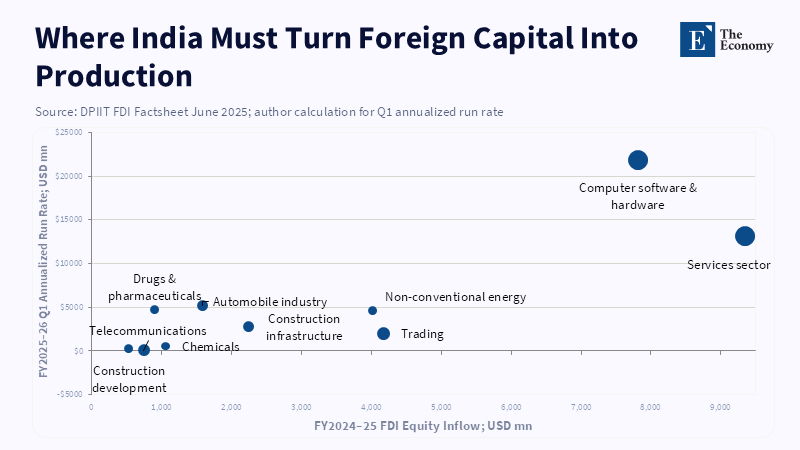
India’s real opportunity lies in sectors where fresh inflows, growth momentum, and long-term FDI depth can become production capacity. Related Articles:
Read More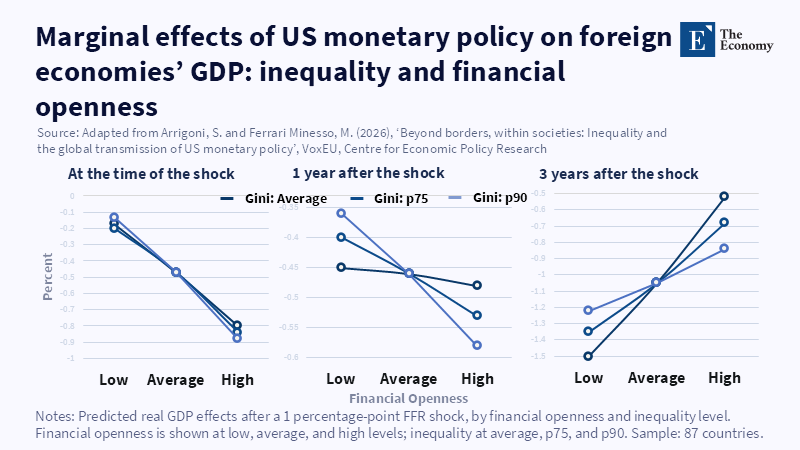
Financial openness changes the transmission channel: the same US shock can ease or deepen the GDP effect depending on inequality and market exposure. Related Articles:
Read More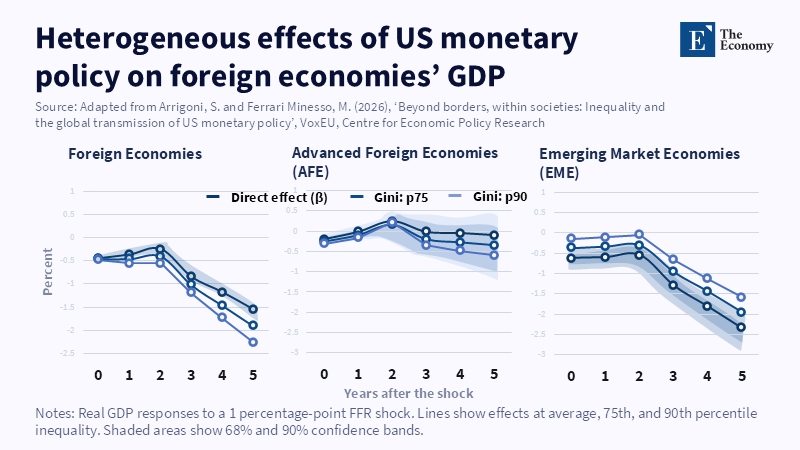
One US rate shock produces very different GDP losses across foreign economies, with emerging markets showing the sharpest delayed decline. Related Articles:
Read MoreJapan and South Korea show Thailand’s next risk: housing can move from scarce urban asset to stranded local burden once ageing and low births reshape demand. Related Articles:
Read More
Thailand’s housing pressure is not easing yet: deaths now exceed births, while ageing keeps older-owned homes locked in place and delays any relief in city markets. Related Articles:
Read More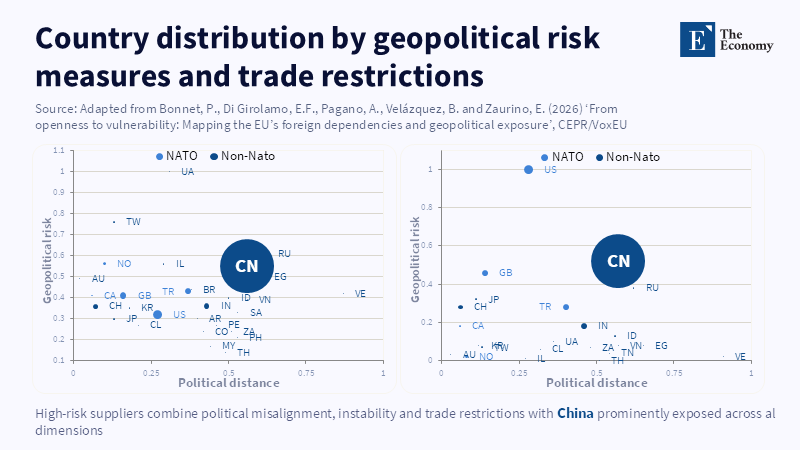
Dependency becomes strategic risk when product concentration overlaps with political distance, instability and trade restrictions.
Read More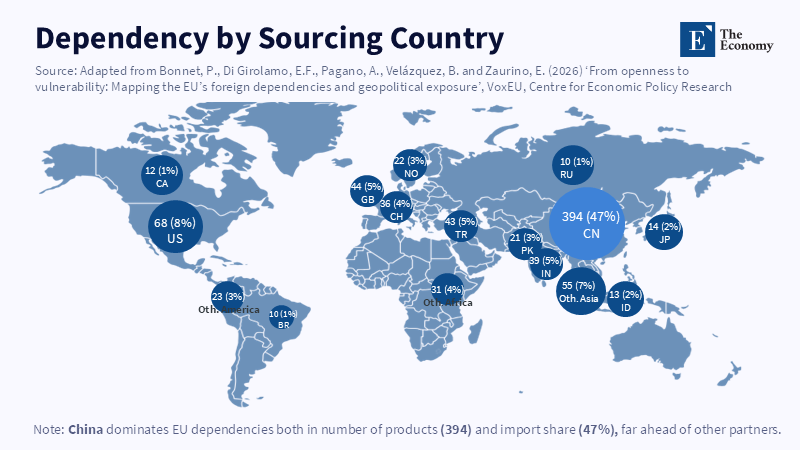
China is not one supplier among many.
Read More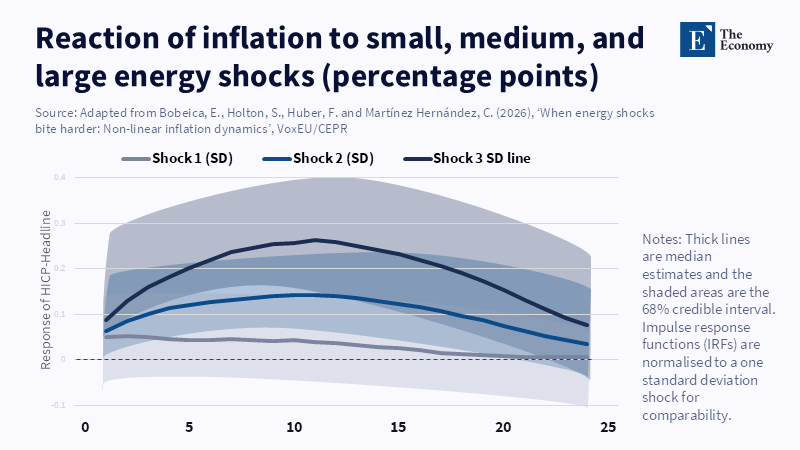
Large energy shocks do not simply produce larger effects; they bend the inflation response upward and make pass-through more persistent.
Read More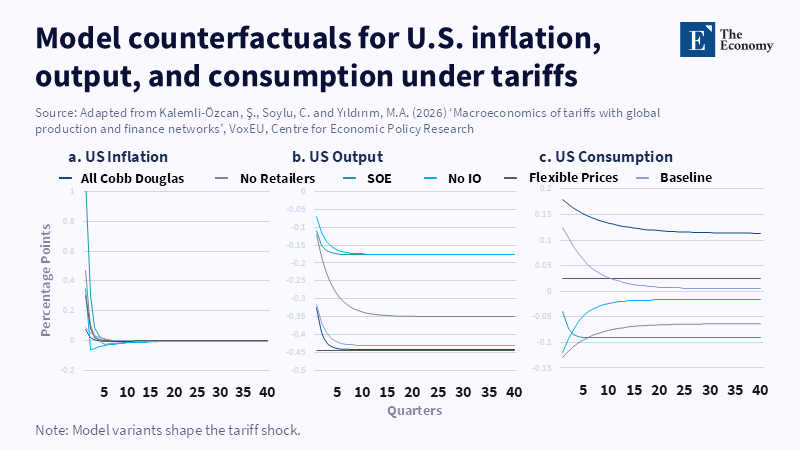
Tariffs become stagflationary when the shock passes through production networks, prices, output, and consumption at once.
Read More