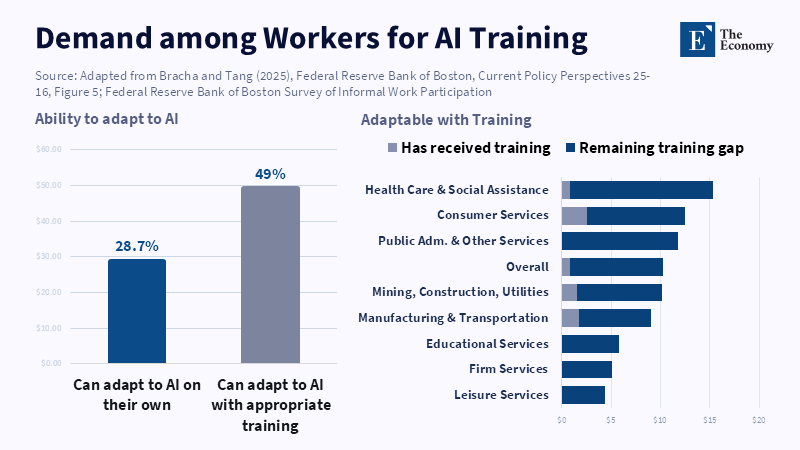
Workers are not rejecting AI; many are asking for the training needed to adapt. Related Articles: The AI Job Market Needs a Demand Policy, Not a
Read More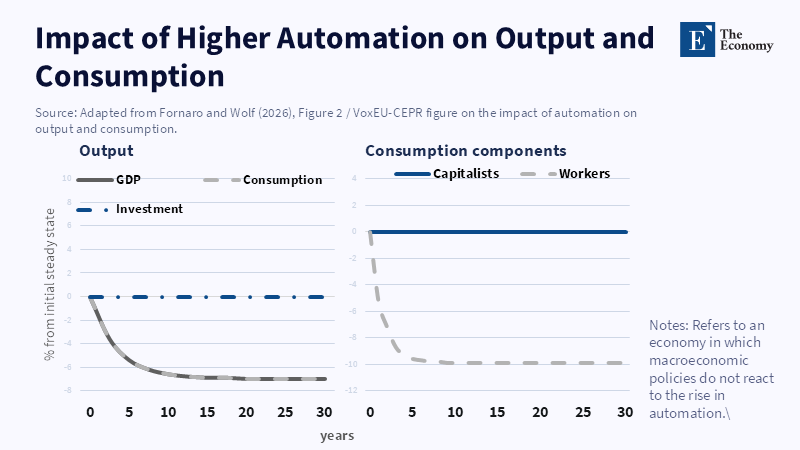
Automation can raise firm efficiency while weakening output when worker consumption falls. Related Articles: The AI Job Market Needs a Demand Polic
Read More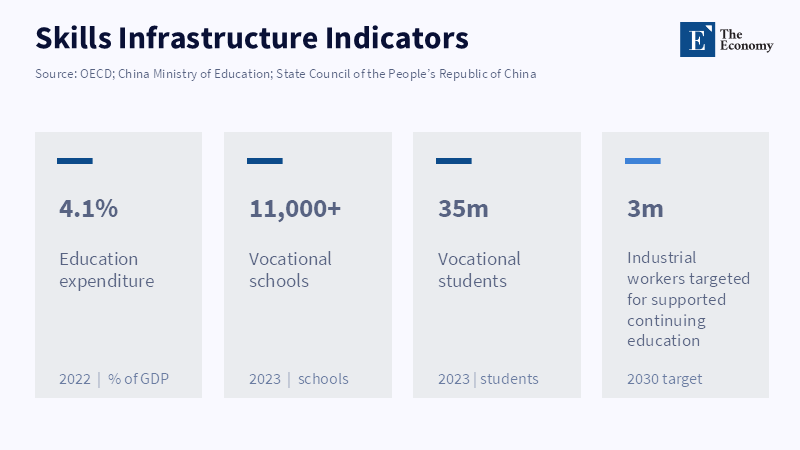
China’s skills pipeline shows why subsidies work differently when schools, firms and state planning are aligned. Related Articles:
Read More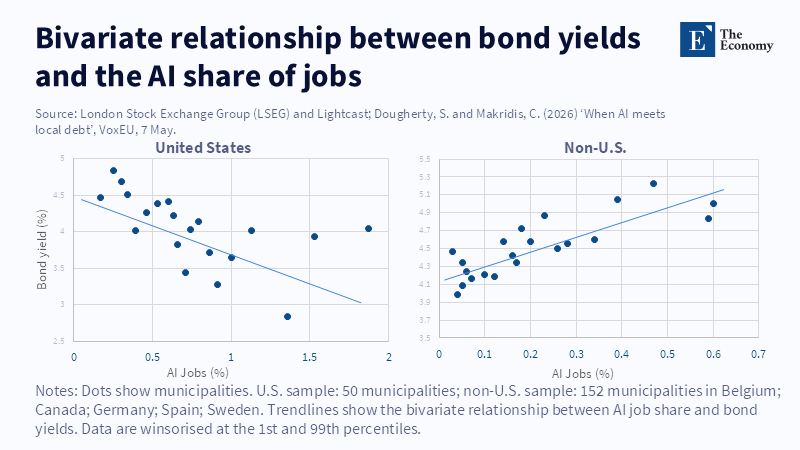
The split between U.S. and non-U.S. markets shows that AI is not automatically credit-positive.
Read More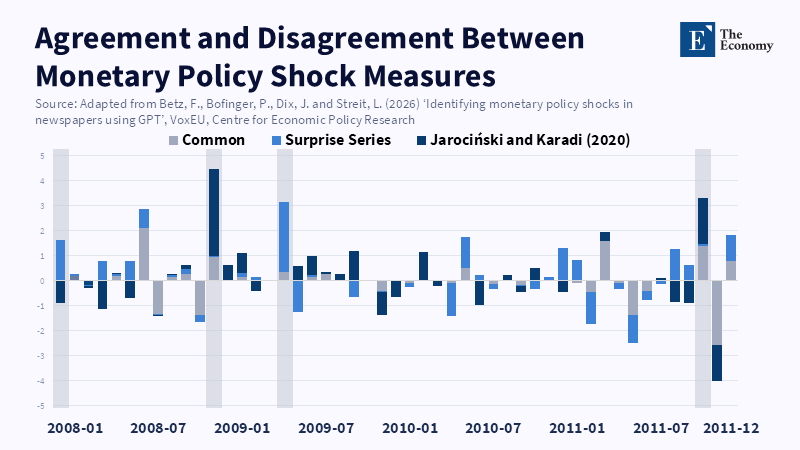
The figure separates shared movements from disagreement between newspaper-based and market-based shock measures, showing where a “shock” may reflect interpretation gaps rather than a clean policy surprise.
Read More


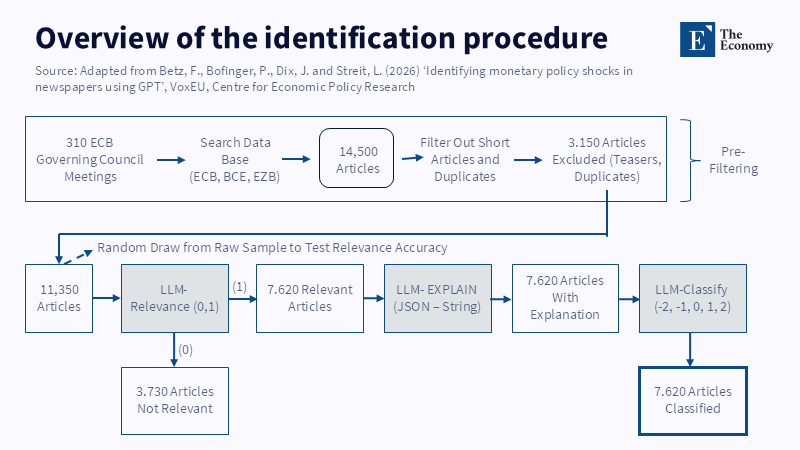
The figure shows how raw ECB newspaper coverage is filtered, checked for relevance and converted into a five-point monetary policy signal from strongly expansionary to strongly restrictive. Related Art
Read More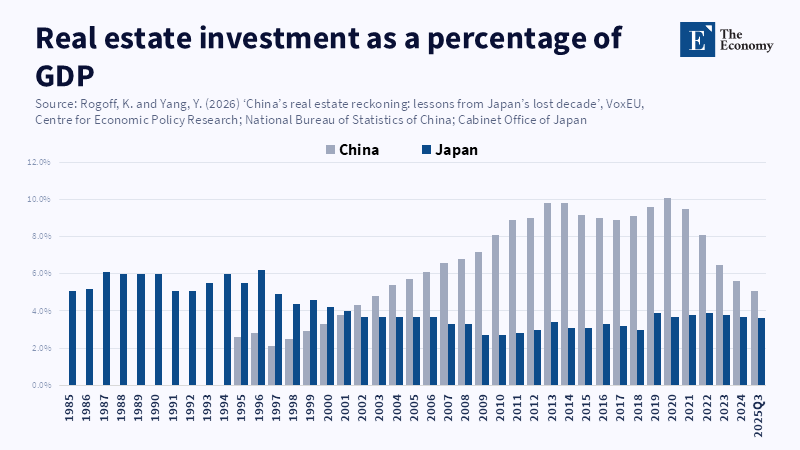
China’s property downturn is no longer a normal cycle; the fall in real estate investment now resembles the early stage of a long post-bubble adjustment. Related Articles:
Read More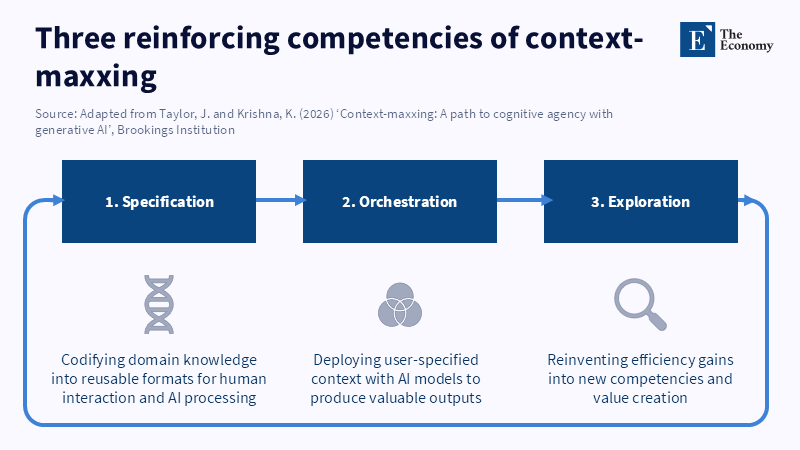
Value-Maxxing depends on three competencies: specifying useful context, orchestrating AI workflows, and reinvesting efficiency gains into new value. Related Articles:
Read More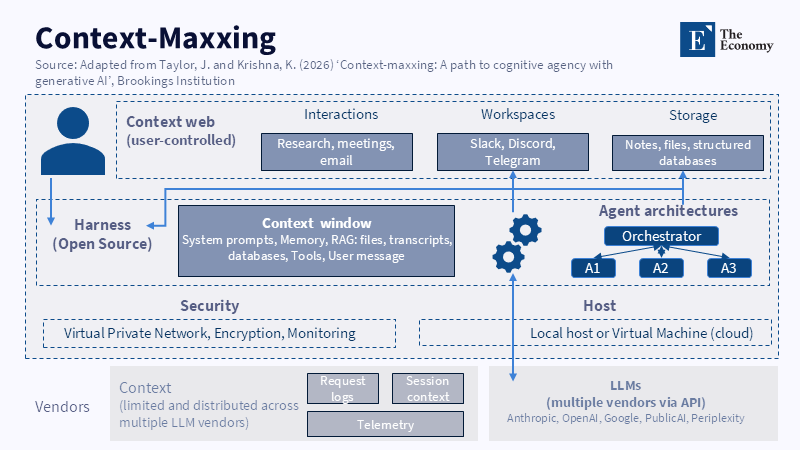
User-controlled context turns AI from a vendor interface into a governed system of memory, tools, security, and judgment. Related Articles: Value-Maxxing: The AI Met
Read More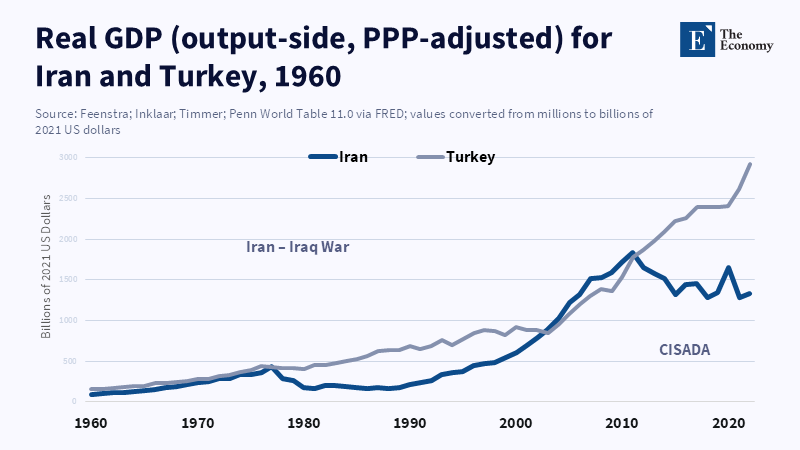
Iran’s widening gap with Turkey shows why sanctions relief is a regime-level political issue, not a diplomatic sweetener. Related Articles: The
Read More
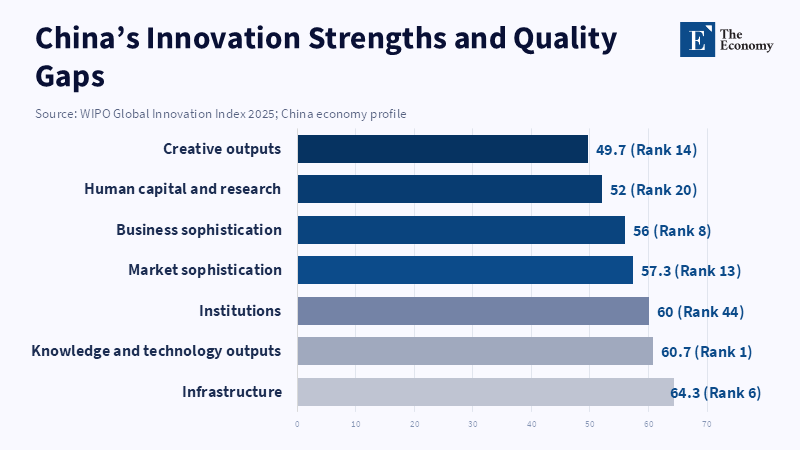
China’s innovation system is strong in output, but weaker institutional scores show why trust still has to be earned.
Read More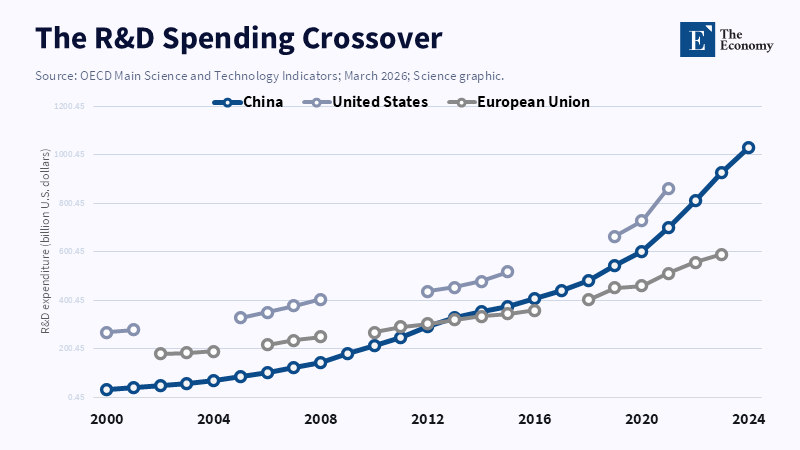
China’s R&D rise shows why its manufacturing story is shifting from low-cost scale to deeper scientific capability.
Read More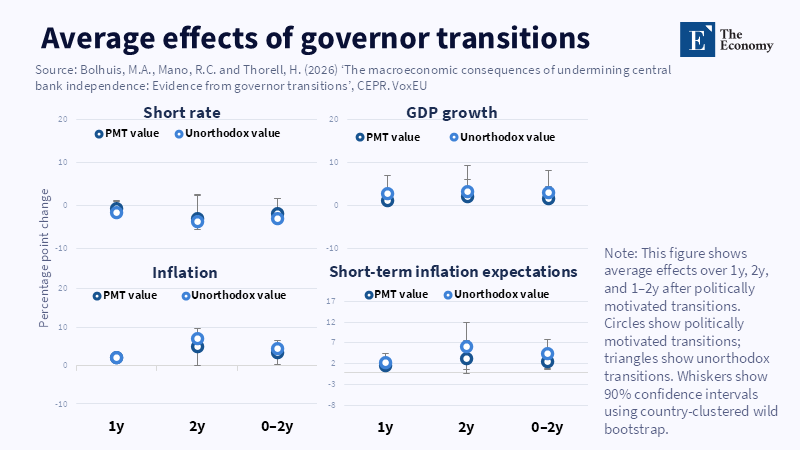
Political pressure can lower rates and lift growth briefly, but inflation and inflation expectations rise.
Read More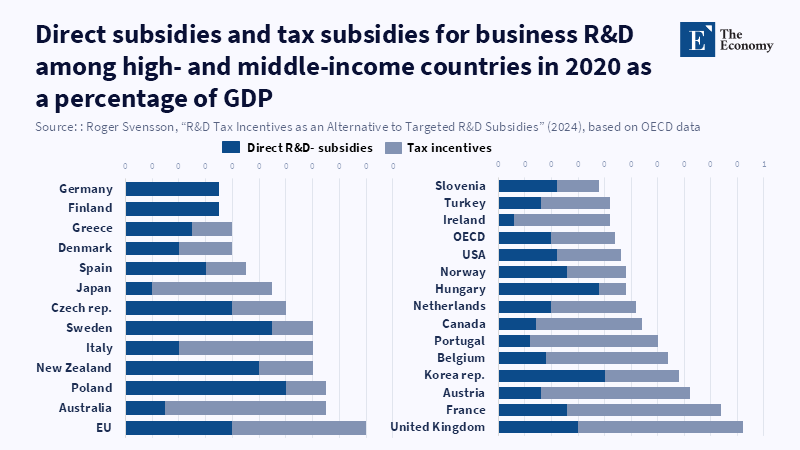
Public R&D support is not one model: some countries rely more on direct project funding, while others route support through tax incentives.
Read More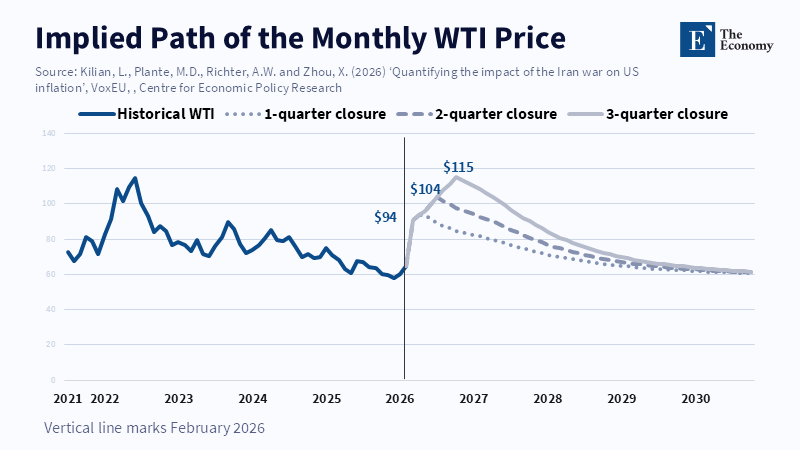
Longer closure scenarios keep oil prices elevated for longer, making the speed of reopening the central inflation variable.
Read More
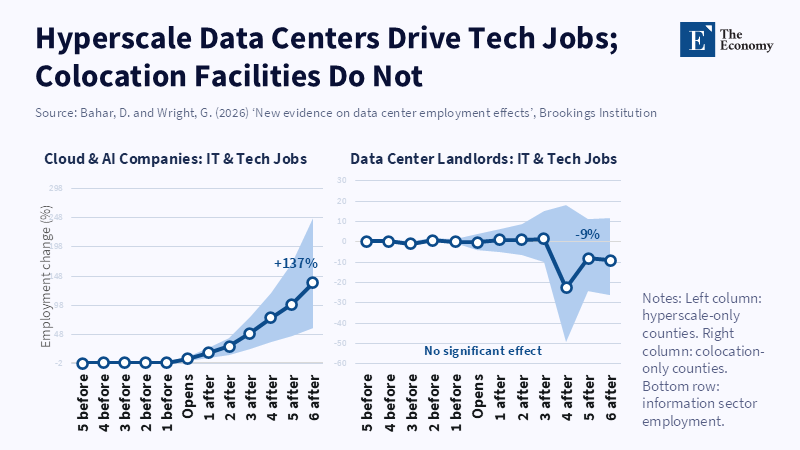
Tech-job spillovers appear around cloud and AI operators, while landlord-style colocation sites show no clear local IT effect.
Read More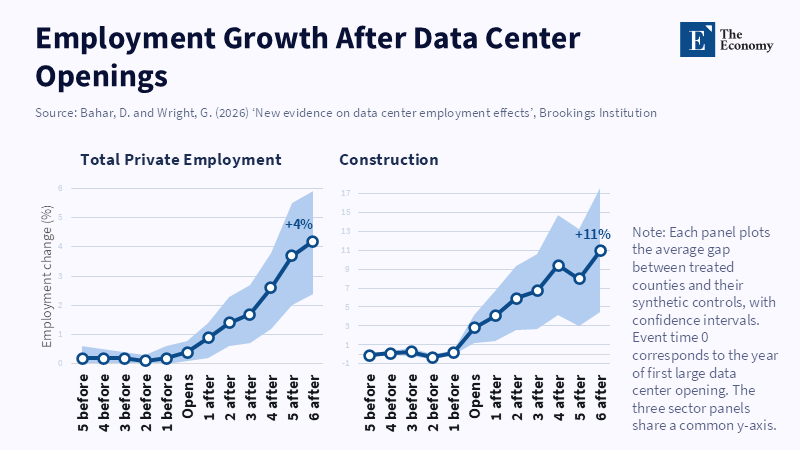
Data centers lift local employment, but the clearest early gain is concentrated in construction.
Read More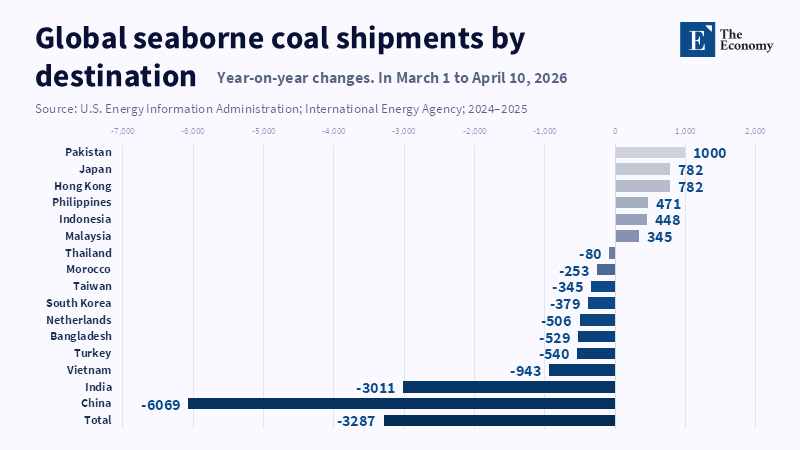
Coal shipment changes were uneven, but the sharpest declines came from China and India, complicating the idea of a broad coal rebound.
Read More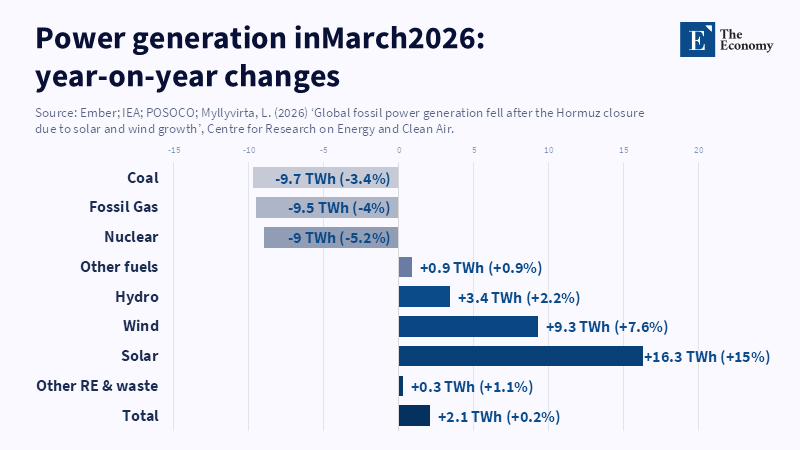
Solar and wind absorbed much of the shock, weakening the claim that the Hormuz crisis produced a simple coal comeback.
Read More