Perceived Inflation Is the New Test of Price Policy

Working across research, policy, and data-driven analysis, the Editorial Board ensures that published pieces reflect a consistent institutional perspective grounded in quantitative reasoning and long-term structural assessment.
Authored On
Modified
Official inflation can fall while household price pressure remains high
Different spending baskets create different inflation experiences
Policy should pair CPI with clear perceived-inflation indicators
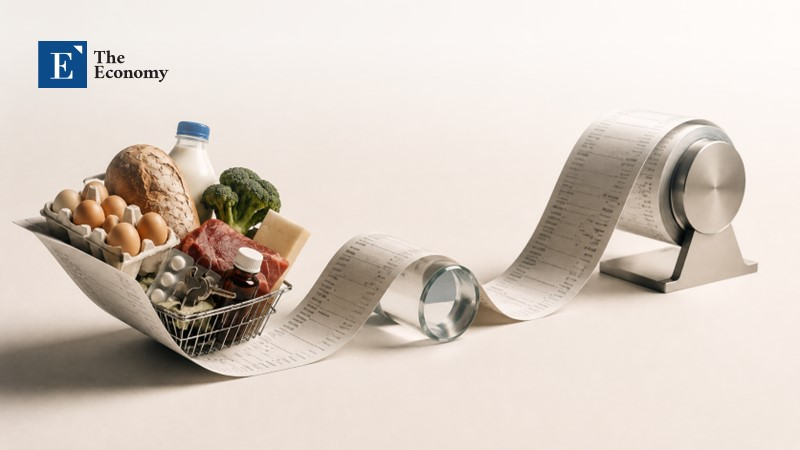
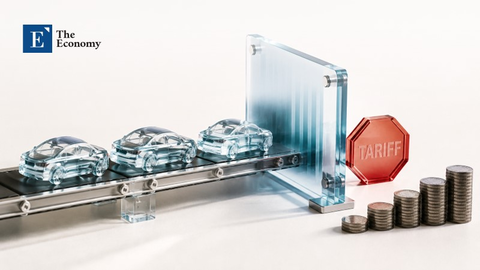
A country can show a low inflation figure while, at the household level, people still believe they are living in a high-price world. Canada illustrates the problem in a single clear figure. In 2025, Canada’s annual average consumer price index increased by 2.1 percent, the smallest growth since 2020. However, prices were still 19.9 percent higher than five years ago. This is the gap that now defines perceived inflation. The pace has slowed down, but the bill has not gone back. Households do not purchase the CPI rate; they purchase rent, petrol, bacon, beans, antibiotics, repairs, sports shoes and rail fares. When all those items remain expensive, a lower rate can sound like denial. This is not merely a public relations concern for central banks; it is a design issue of policy. Official baskets continue to have significance, but now a lived basket has an even greater role to play in shaping public confidence.
Perceived Inflation Is Global, Not European
The key point is not the failure of one region to explain prices. Spotting inflation has become a test of public policy worldwide. The official consumer price index is designed to show how much the average household spends. That remains important. Without a shared yardstick, it would be hard to keep wages, pensions, tax levels, contracts and inflation goals aligned. But this same simplicity is why the CPI is flawed. It is straightforward because it reflects the average. It is limited because it asks a single household to be typical. A retired owner, a commuter, a renter with children and a student in a city, all experience inflation in different aisles.
This is why the wrong basket argument is appealing but half-formed. Authorities can update weights more quickly, improve rent surveys, attribute quality variations and produce clearer local statistics. Those changes are absolutely necessary. They will not remove perceived inflation. More fundamentally, it boils down to proportional sensitivity. A ten percent increase in food costs has the greatest effect if 30 percent of income goes there. A decline in electronic prices sweetens the index just as much as it does little for a household, postponing every large expenditure. Petrol price upheaval has more impact on commuters than it does on satellite office workers. This is not irrational. It is simple math dressed in science. The public is not misreading inflation. It is misreading a different bill.
Perceived Inflation Begins at the Basket, but Does Not Stop There
Canada provides a convenient cautionary tale because the measurement problem is so obvious. Its CPI basket is about 700 goods and services. While such an extensive basket is still necessary to maintain a stable inflation target, it causes conflict. Not all households consider the CPI basket to be their basket. Not all can see the quality change in the rising sticker prices of improved products. Many assess housing by looking at house prices, rent notices and mortgage pressure, while the CPI counts housing only in the narrower measure of services. That may be right in the macroeconomy, but it is hard to defend it at the kitchen table when nothing else is affordable.
The point is not that households always beat the statisticians. They don't. Canadian data have proved that detailed baskets for groups by age, income, education and housing tenure often compete well with the national CPI. This matters because it dispels the claim that official inflation is misleading or false. But it also makes a more subtle point. If detailed baskets alone cannot account for the whole discrepancy, basket adjustment cannot be the universal cure. Human behavior must count. Price rises attract more comment than price falls. Most commonly bought items matter more. Food and petrol are recalled because they are bought so frequently. Housing is recalled because it shapes life decisions. Seen through the lens of inflation, prices are less decisive than memory, loss, anxiety and repetition.
Perceived Inflation Reacts to Shocks with a Lag
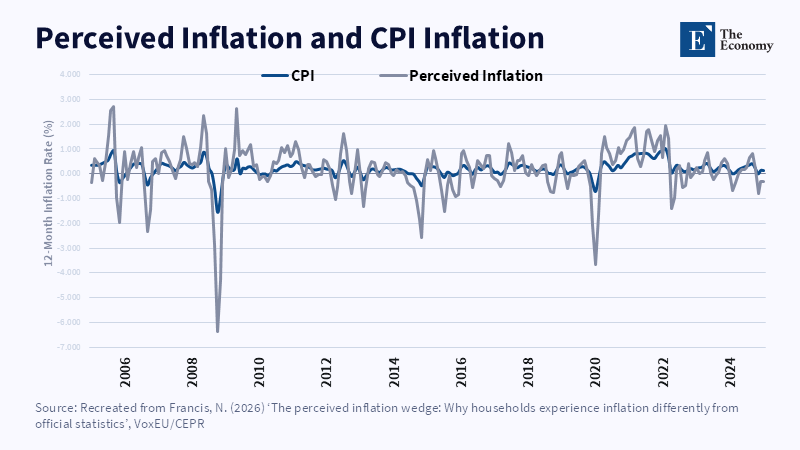
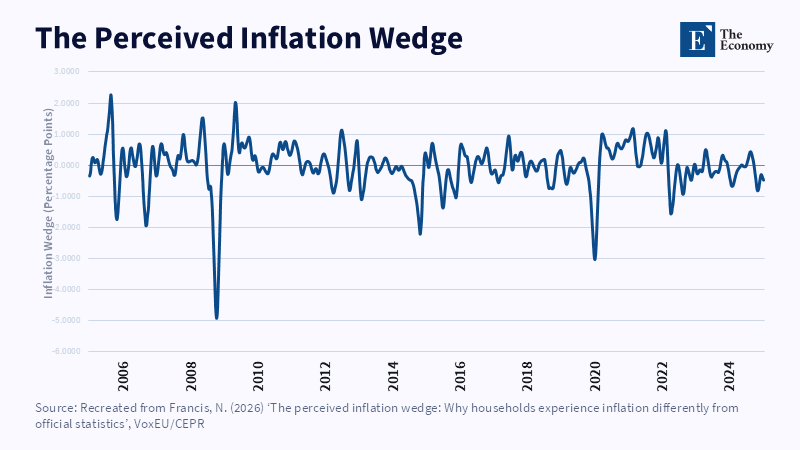
The euro-area evidence is most unambiguous. The 2020- 25 cycle contains two simultaneous effects. One is a structural bias caused by age, income, digital skills and frequency of purchase. According to euro-area data, perceived inflation during 2022-25 among the lower-income decile was approximately 0.9 percentage points higher than that among the top decile. Similar gaps are found for the over-65 age group as against 18 - 34 at about 1.6 percentage points (from 2022-25) and about 0.8 percentage points (after 2024). While these differences are not particularly large, they are of major political significance as they evidence unequal experienced inflation, experienced to a greater extent among less equipped groups.
Bigger and more unpredictable than the first is the second force. Perceived inflation is sticky. In the euro area, it lagged by about four months behind actual inflation. That lag spawns a cycle of distrust. When inflation is accelerating fast, households will understate the size of the jump-because they are anchoring the memory of prices of the period before. When it is decelerating fast, households may overstate it-the pain is fresh, not past. The social dimension of the last mile of disinflation. Headline inflation is close to target, while perceived inflation is still well above it. This does not point to a denial of the facts, but the slow fading of price memory. A household can accept that prices are lower today, but still perceive the cost shock as incomplete.
Inflation Expectations Influence Wages, Trust, and Policy
The lag is relevant because perceptions of inflation do not remain in survey responses. They filter into wage formation, consumption and debt decisions and confidence in government. In the Euro-area, nominal wage growth tended to follow inflation with a lag of between 1 and 2 quarters. Real wage growth was sharply negative early in episodes of high inflation and then rebounded as inflation subsided. The estimated correlation between inflation and real wage growth was around minus 0.86 over the cycle. Cost shares moved in an opposite direction. The lesson is clear: price shocks can affect income distribution directly, before the relative bargaining strength of workers has been re-established. By the time workers are again receiving the real wages to which they are entitled, confidence in the system has already been eroded.
Better central-bank communication is not enough. Information matters only when it links to the observed prices. The same pattern emerges in South Korea in another setting; research exploiting Bank of Korea consumer survey data demonstrates a considerable and persistent overestimation bias in household inflation expectations. Canada shows that households, in general, also differ over time from firms and market participants, in part because firms have good reasons to follow the data very closely. The global pattern is clear. Households are not miniature central banks: they update through shopping, rent notices, wage negotiations, family budgets, the media and stress. A language based only on headline CPI will miss the channel through which trust is lost.
Perceived Inflation Requires a Public Price Dashboard
The right response to the perceived failures of today's CPI would not be to abandon it. It would be to add its shortcomings in a new 'perceived inflation' indicator. A public touchstone for day-to-day inflation, where CPI itself is not replaced but complemented by a handful of basic measures. It would include the headline rate, also for more common day-to-day goods and services, the rate of essentials, pressure from rent and mortgage costs, the price of food at home, the cost of energy and a few typical household profiles, grouped by income, age and type of homeownership or renting. They would not try to be any family's model. It would illustrate how the average is not necessarily the only truth. Much of their evidence is already in the official data system. The missing element is public design.
Such a dashboard would also serve as a discipline on policy. Governments wouldn't be able to select a favorable headline that the headline rate is falling when food or rents remain elevated. They wouldn't be able to claim that the official index is unreliable when the broad one is clearly functioning. The goal is a two-tiered truth. The CPI shows whether a sense of whether the general level of prices is rising; perceived inflation measures things such as whether people are likely to think it is. That differentiation should be the guiding principle for central banks, finance ministries, labor negotiators and social policy bodies. Policies on indexation, benefit adjustment, minimum wage setting and tax thresholds should all be tested with the official basket and the experienced one in mind.
Perceived Inflation Must Become a Core Policy Signal
The probable line of argument is that more indicators make things more complicated. Can a national dashboard ever be relied upon as neutral? Will it be used as a political weapon? These dangers are real. But the current system creates confusion because one number is being asked to carry too much burden. Stable and transparent additional measures would reduce noise rather than bring it from nowhere. The criteria should be transparent and binding. The consumer price index is the point of reference and the legal anchor. Perceptions of inflation are ancillary indicators. They reveal who is in pain, why it persists and where communication can go wrong. There is no populism in this. It is a more refined assessment of the social channel through which inflation registers in behavior. The more profound criticism is that the perceived inflation is too subjective to warrant anything but serious policy attention. That is no longer a valid position. Subjective does not equal useless. Expectations are already embedded in the core of inflation policy. Consumer confidence, business sentiment and market measures of forecasts all influence real decisions. So does perceived inflation. It is not one degree; it is the household reading of the degree. When policy ignores the latter, officials see disinflation and households see evasion and the differences can be too great to bridge. When the latter is accounted for, the differences are finally manageable. The challenge is to make inflation policy honest about averages, but not blind to averages and variations.
The Canadian number captures the new problem. A 2.1 percent inflation rate can co-exist with a 19.9 percent five-year increase in prices. One piece of information tells the economy that inflation has eased. The other tells households where they remain so weak. Price policy must be able to speak both messages. The basket can be calibrated better and it should be. But the basket will never be one person's life. The next round of inflation policy must see perceived inflation as a vital public signal. Not as competition for the CPI. Not as a slogan. As the missing link that connects official improvement and household conviction. Absent that link, every future bout of inflation will bring with it the same loss of trust: lower rates, higher prices and a public that does not recognize the claimed improvement.
The views expressed in this article are those of the author(s) and do not necessarily reflect the official position of The Economy or its affiliates.
References
Ahn, Y.B. and Tsuchiya, Y. (2023) ‘Consumers’ perceived and expected inflation in South Korea’, Applied Economics Letters, 30(11), pp. 1561–1565.
D’Acunto, F., Malmendier, U., Ospina, J. and Weber, M. (2021) ‘Exposure to grocery prices and inflation expectations’, Journal of Political Economy, 129(5), pp. 1615–1639.
De Grauwe, P. and Ji, Y. (2026) Inflation Perceptions and Expectations: Inertia, Biases and Policy Implications. Monetary Dialogue Paper PE 779.873. Brussels: European Parliament.
Francis, N. (2026a) ‘The perceived inflation wedge: Why households experience inflation differently from official statistics’, VoxEU, 6 July.
Francis, N. (2026b) The Perceived Inflation Wedge. NBER Working Paper No. 35354. Cambridge, MA: National Bureau of Economic Research.
Schembri, L.L. (2020) ‘Perceived inflation and reality: Understanding the difference’, remarks to the Canadian Association for Business Economics, 25 August. Ottawa: Bank of Canada.
Statistics Canada (2026) ‘Consumer Price Index: Annual review, 2025’, The Daily, 19 January.
Working across research, policy, and data-driven analysis, the Editorial Board ensures that published pieces reflect a consistent institutional perspective grounded in quantitative reasoning and long-term structural assessment.