Rapid Shifts in Renewable Energy Costs: Is the United States Moving Against a Global Cost-Down Trend?

Authored On
Modified
Large-scale projects can reach nuclear-level costs
Costs diverge by site conditions and regulation
Policy swings + long-term cost advantages fuel volatility
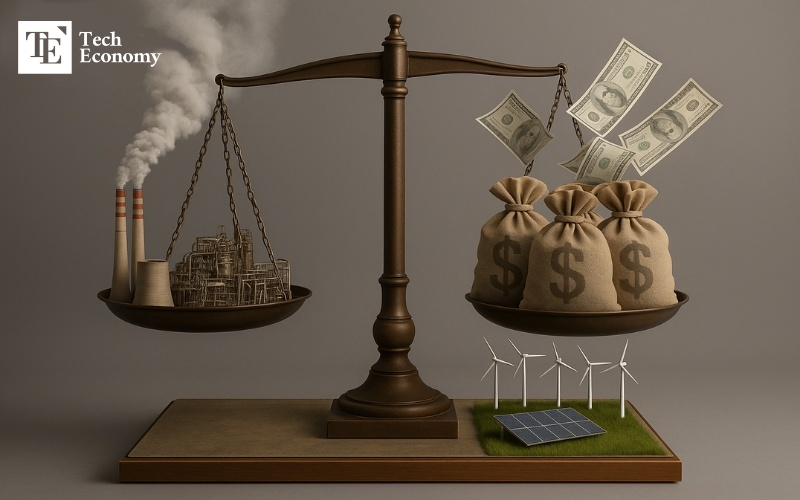
Global renewable-energy costs have declined steadily in recent years, emerging as a decisive force reshaping the power-market landscape. As the pace of cost reduction accelerates, Europe is using the trend to justify faster energy-transition policies, doubling down on solar- and wind-based expansion strategies. The United States, by contrast, faces diverging views as electricity-rate increases and political conflict collide, creating deep splits in public and policy sentiment. With the global energy market now reorganizing around cost competitiveness, America’s policy pullback risks clashing with the broader trend—ultimately widening cross-country gaps in power-generation costs and transition speeds.
Cost declines driven by improvements in technical efficiency
According to OilPrice on the 17th (local time), renewables such as wind and solar are now viewed as the most economical power option worldwide, but deployment and expansion in the United States—despite being the world’s largest economy—remain mired in political dispute, creating major obstacles for new projects and grid stability. The outlet noted, “At the current trajectory, global temperatures are projected to rise 2.8°C above pre-industrial levels by around 2100,” adding that “political infighting, permitting delays, and grid-expansion bottlenecks in the U.S. are producing a contradictory situation in which even the world’s second-largest emitter cannot scale renewable-energy investment at the necessary pace.”
These projections are grounded in numerical analysis based on levelized cost of energy (LCOE) by generation source. In a study applying the National Renewable Energy Laboratory (NREL)’s methodology, the Lawrence Berkeley National Laboratory (LBNL) under the U.S. Department of Energy projected that LCOE for utility-scale solar (20MW, 100MW) will fall to USD 47–48 per MWh by 2030—the lowest among all generation types, including nuclear. Nuclear LCOE for the same period was estimated at roughly USD 50/MWh, reflecting annual construction-cost increases of 2.6%.
Coal LCOE showed a similar trajectory to today’s levels, shaped by declining capacity factors, rising construction costs, and fuel-price fluctuations. Gas-fired LCOE was expected to enter a temporary downturn through 2030 as fuel prices return to pre-war norms following the Russia–Ukraine conflict, before rising again. When social costs such as nuclear accident-risk externalities and carbon-emissions costs from coal and gas are included, nuclear LCOE for 2030 rises toward USD 60/MWh, while coal and gas increase by 113% and 41%, respectively.
A comparison between gas–green hydrogen co-firing and solar-plus-energy-storage (ESS) systems found that solar-ESS LCOE continues to decline as module and battery prices fall, while the high cost of green hydrogen undermines the competitiveness of gas co-firing. Based on these results, researchers estimated that utility-scale solar overtook nuclear in cost competitiveness in the late 2020s and will become the cheaper option by around 2030. The findings indicate that solar and offshore wind are shifting from “subsidy-dependent alternatives” to mainstream power sources.
Corporate cost pressure → national competitiveness disputes
However, these scenarios assume the feasibility of large-scale installations, which limits applicability in countries where land constraints and permitting barriers are high. South Korea is a representative case. According to BloombergNEF, Korea’s solar LCOE last year was USD 98/MWh—3.3 times higher than China’s USD 30 and 2.8 times the global average of USD 35. Since LCOE reflects total construction, operating, and financing costs over a plant’s lifetime, the data reaffirm that identical modules and technologies can yield vastly different costs depending solely on financing conditions and regulatory environments.
Wind-power disparities are even more dramatic. China’s onshore wind LCOE is USD 30/MWh—similar to solar—while Korea’s is USD 126/MWh, 4.2 times higher. Compared with the global average of USD 37, Korea remains an extreme outlier. For offshore wind, Korea’s LCOE is USD 300, versus China’s USD 59—a 5.1-fold difference. China has reduced intermittency and financing costs through years of large-scale investment in grids, storage, and transmission. Korea, by contrast, faces accumulated burdens from limited sites, regulatory delays, high financing costs, and grid-congestion charges, creating structurally higher wind-power prices.
IEA’s 2020 power-generation-cost report shows the same pattern: Korea’s LCOEs—USD 96.6 (solar), USD 113.3 (onshore wind), USD 161 (offshore wind)—all exceed nuclear (USD 53.3), coal (USD 75.6), and combined-cycle gas (USD 86.8). Meanwhile, in the U.S., China, Europe, and India, solar and onshore wind are typically cheaper than coal and gas, with many cases where renewables undercut nuclear. In India, solar LCOE at USD 35.5 is lower than coal’s USD 70.5 and nuclear’s USD 66.1; the U.S. shows solar at USD 44 and onshore wind at USD 39, both lower than combined-cycle gas at USD 45.
Korea’s unusually high renewable-energy costs stem largely from indirect expenses. A 2021 report by the Korea Energy Economics Institute noted that Korea’s solar installation costs are only 10% higher than overseas on average—and module plus construction costs are actually 18% lower—yet indirect expenses such as financing costs and permitting delays are 68% higher. Companies also face limits: rooftop solar on offices or factories can supply at most 15% of on-site power demand, and REC/PPA prices remain higher than industrial electricity tariffs. These compounding constraints mean that even with LCOE showing renewables’ theoretical cost advantage, full-system cost structures prevent competitive outcomes in certain countries.
Strengthening consensus: “The renewable transition is unavoidable”
For this reason, debates over renewable-energy costs are intensifying worldwide. The International Renewable Energy Agency (IRENA) reported that global average onshore wind LCOE for new projects fell 15% in a single year to USD 0.033/kWh, while solar and offshore wind LCOEs declined 13% to USD 0.048/kWh and USD 0.075/kWh, respectively. IRENA noted that new renewable-energy capacity added last year reached 257GW, accounting for 81% of all new power-generation capacity, adding that facilities completed last year could reduce global power-generation costs by up to USD 55 billion this year.
Europe is using this cost evolution to accelerate policy realignment. The EU has legislated a target to raise its renewable-energy share from 22% in 2020 to 40% by 2030 and is simultaneously pushing to reduce reliance on Russian fossil fuels. Germany’s revised Renewable Energy Act plans to expand solar capacity from 60GW to 215GW by 2030, onshore wind from 56GW to 115GW, and offshore wind from 8GW to 30GW—equivalent to adding 22GW of solar annually.
The United States, however, is charting a different path despite facing the same cost data. The administration and the Republican Party have repeatedly attributed rising electricity rates to renewable-energy mandates, using this narrative to justify slowing new projects and scaling back tax incentives. U.S. residential electricity prices have risen roughly 30% since 2021 and another 5.5% over the past year, making power bills a major contributor to inflation concerns. President Donald Trump has cited New Jersey as an example, arguing that “states adopting renewables are seeing electricity prices soar.”
Yet the American Clean Power Association reports that New Jersey operates only six wind turbines, supplying just 0.03% of the state’s electricity—casting doubt on claims tying rate hikes to renewables. Additional upward pressures include higher natural-gas prices, replacement costs for aging transmission networks, transformer shortages, and new gas-plant construction to serve AI data centers. As global renewable-energy costs continue to fall, differences in policy orientation, grid infrastructure, and cost-allocation mechanisms are increasingly driving national electricity prices onto sharply divergent trajectories.
Similar Post