The U.S. Economy Sustained by the Top 30%, Transitioning from a ‘K-Shaped’ to an ‘E-Shaped’ Structure

Authored On
Modified
Expansion of the ‘Upper Middle Class’ Driven by Education and Income
Consumption Trajectories Fragment into Three Distinct Tiers
Consumption Landscape Reconfigured Around High-Income Households
An analysis has found that a growing number of households in the United States are entering the “upper middle class,” propelled by rising incomes. Contrary to the prevailing perception of a shrinking middle class, a substantial share of households has moved upward as absolute income levels have increased. This shift is accelerating a transition away from the traditional K-shaped economic structure toward an “E-shaped” fragmentation, where income tiers diverge into three distinct paths. As the purchasing power of higher-income groups becomes more entrenched, the divergence between a stagnating middle class with limited asset accumulation and a debt-burdened lower-income population continues to widen.
Tripling of High-Income Households Over 50 Years
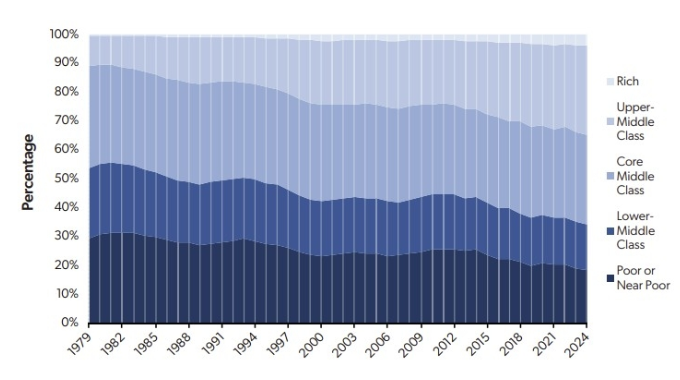
According to the AEI report titled “The Shrinking Middle Class Amid the Surge of the Upper Middle Class,” released on the 5th (local time), the traditional middle class—once the “thick waist” of the U.S. economy—has largely transitioned into the upper middle class, forming a powerful buffer supporting the lower end of the economic structure. AEI classifies U.S. households into five groups based on income: affluent, upper middle class, core middle class, lower middle class, and poor or near-poor. Households earning between five to fifteen times the income of those in poverty are categorized as upper middle class.
The economic standing of U.S. households has risen markedly compared to the 1970s. The share of the upper middle class increased from approximately 10% in 1979 to 31% in 2024, more than tripling. This indicates that roughly three in ten Americans now fall within a high-income bracket, earning between $133,000 and $400,000 annually. As a result, the U.S. consumption landscape has shifted from a broad middle-income base to one centered on high-income households.
By contrast, the share of core middle-class households declined from 35.5% in 1979 to 30.8% in 2024. The lower middle class fell from 24.1% to 15.8%, while the share of households in poverty decreased from 29.7% to 18.7%. AEI highlighted that, for the first time in U.S. history, the proportion of households better off than the core middle class (34.8%) has surpassed those worse off (34.5%). The combined income share of the upper middle class and affluent households rose sharply from 28% to 68% over the same period.
Education has emerged as the primary driver of upward mobility. Among those holding a bachelor’s degree, 55% belong to the middle or upper class, while the figure rises to 68% for those with graduate degrees. Scott Winship, an AEI researcher, noted that “wage growth has outpaced inflation, particularly among white-collar workers with college degrees, where income gains have been especially pronounced.”
Dual-income households have also played a critical role in facilitating upward mobility. More than 80% of middle-class and higher households are either married or cohabiting, with two sources of income. In addition, the expansion of consumer finance—including credit cards and buy now, pay later (BNPL) services—has created short-term consumption capacity that exceeds income levels. AEI suggests this dynamic explains why Americans continue to spend on premium baby products and high-cost international travel despite elevated inflation.

Downward Rigidity in Consumption Driven by Upward Mobility
The resulting polarization in consumption is now entering a new phase beyond the traditional K-shaped structure. The K-shaped economy has been a defining concept in describing the U.S. economy since the COVID-19 pandemic in 2020. When economic indicators such as income, consumption, and employment are plotted over time across different income groups, the trajectories of upper and lower tiers diverge sharply.
High-income and asset-owning households experience rapid recovery in consumption, supported by rising asset prices and stable income, producing an upward trajectory on the graph. In contrast, lower-income and vulnerable groups face stagnant or declining consumption due to delayed employment recovery and rising cost burdens, resulting in a downward trajectory. When these two trends are overlaid, the divergence forms the shape of the letter “K,” hence the term K-shaped economy.
Economist Peter Atwater, who popularized the concept during the pandemic, described the U.S. economy as resembling a “top-heavy Jenga tower.” This structure can distort economic data: increased spending by wealthy households, driven by asset gains such as stock market rallies, may create the appearance of overall economic growth, even as a large and fragile lower-tier economy persists beneath the surface.
Recently, however, a new term—“E-shaped economy”—has emerged, reflecting the distinct consumption patterns of the middle class. The E-shaped economy also plots time on the horizontal axis and economic outcomes such as consumption or income on the vertical axis. When the consumption trajectories of high-, middle-, and low-income groups are plotted together, three distinct lines emerge, forming a shape resembling the letter “E.”
Premium Consumption Among the Wealthy, Value-Oriented Spending Among the Middle Class
At the top of the E-shaped structure are affluent households and the upper middle class. Despite high inflation, they continue to sustain or even expand consumption, effectively underpinning the broader economy. According to Moody’s Analytics, the top 20% of U.S. households account for approximately 60% of total consumption. Their spending is increasingly shifting toward premium goods, prompting companies to strengthen their offerings in high-end products and services.
In contrast, the middle tier—comprising the core and lower middle class—is gravitating toward “Costco-style consumption” amid rising living costs. This refers to a pattern in which consumers increase bulk purchases at discount or warehouse retailers to mitigate price pressures. While overall spending has not significantly declined, it has become more constrained and less stable. Recent data indicate a growing number of U.S. households are living paycheck to paycheck. According to the Bank of America Institute, approximately 24% of households allocate more than 95% of their income to essential expenses such as housing, food, utilities, and childcare.
At the bottom of the E-shaped economy are low-income households, which are increasingly reliant on credit cards and BNPL services to sustain consumption. According to the Federal Reserve’s Survey of Consumer Finances, 59% of households earning between $25,000 and $50,000 annually reported carrying a credit card balance over the past year, compared with 38% of households earning more than $100,000. BNPL usage is also more prevalent among lower-income groups. A survey by LendingTree found that 25% of BNPL users used the service for grocery purchases last year, a sharp increase from 14% in 2024.
Similar Post